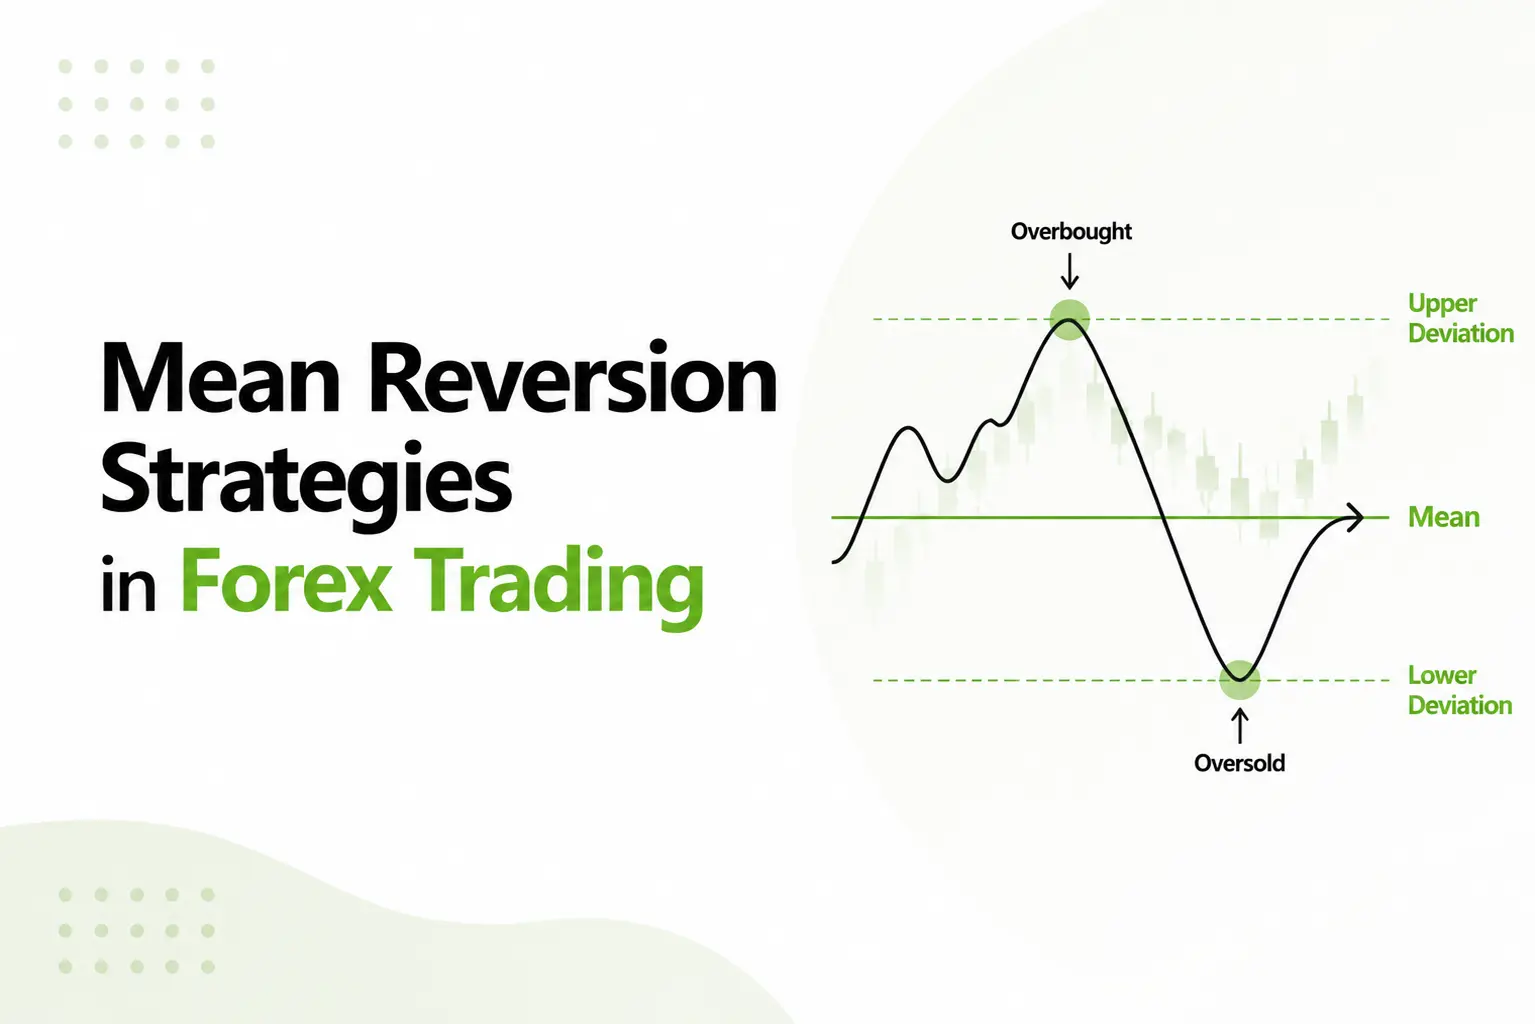

































The central idea is simple: price should be interpreted in context.
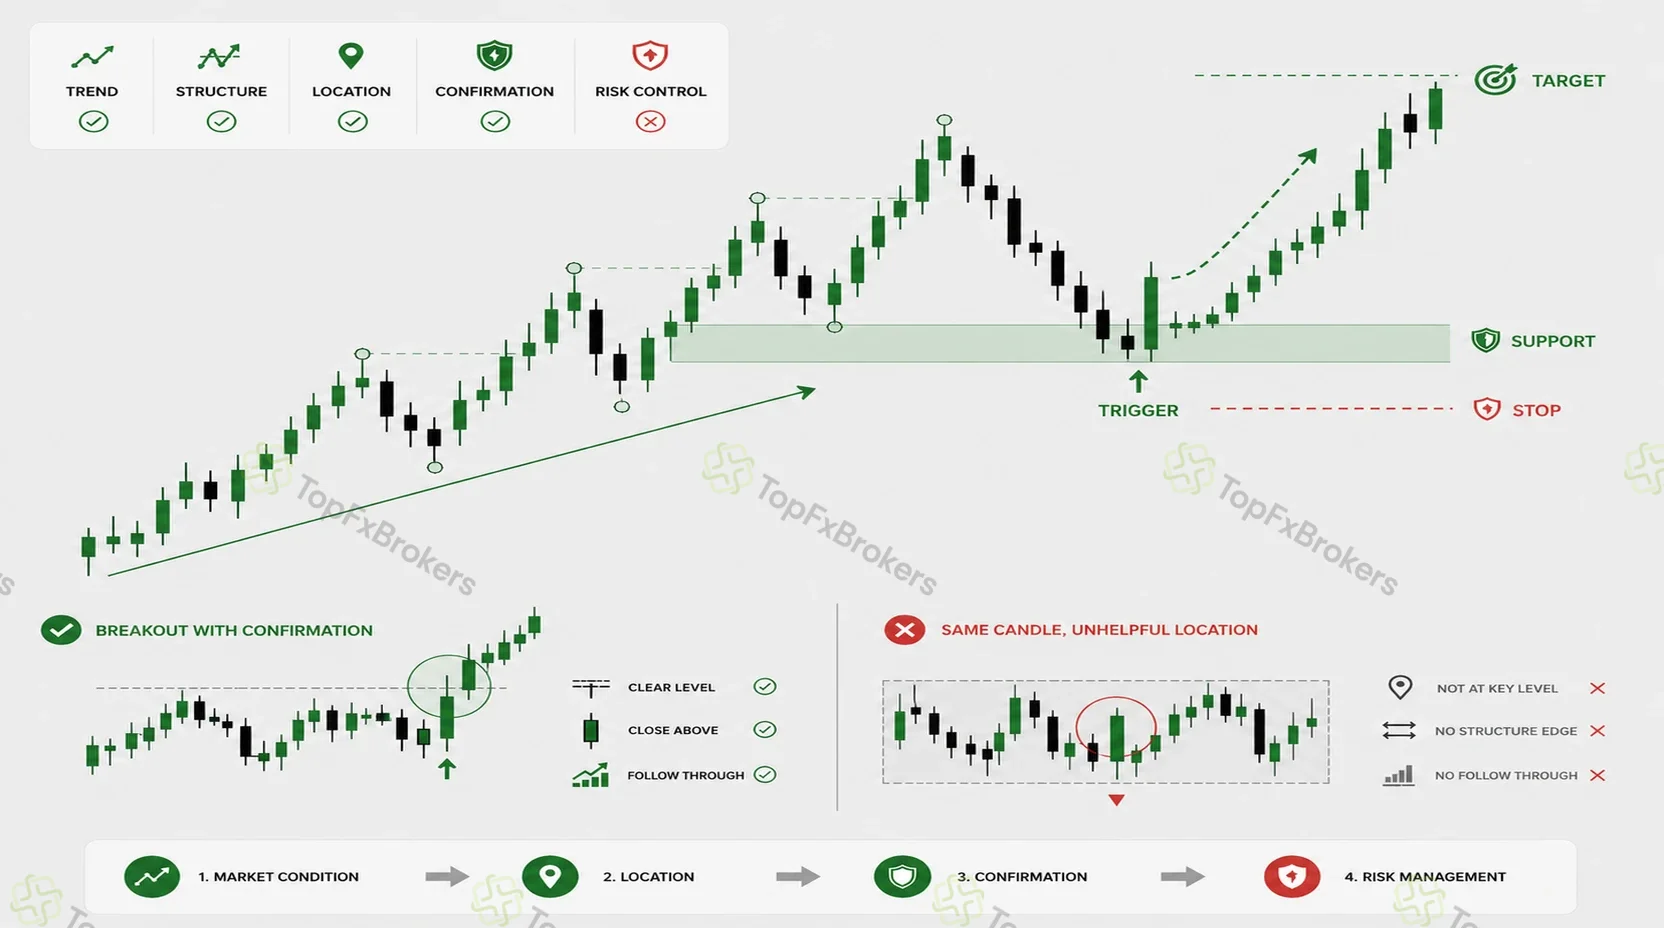
A bullish candle at a well-established support area may contain useful information. The same candle in the middle of an unclear range may mean very little. A breakout is not automatically a valid opportunity either. Its quality depends on where it occurs, how decisively price moves through the level, whether the market follows through and whether the potential reward justifies the risk.
Price action is therefore more than a catalogue of candlestick names or chart formations. It is a method for answering practical questions. What condition is the market in? Where is price relative to meaningful levels? Is the underlying structure continuing, weakening or changing? What would confirm an entry? Where would the trade idea become invalid? Is there enough room for the position to develop?
This guide explains how to answer those questions and turn chart observations into a structured trading plan.
Risk notice: Trading leveraged financial products involves substantial risk and may not be suitable for everyone. Price action patterns do not guarantee future results. The examples in this guide are educational and are not personal trading advice.
Key Takeaways
- Price action trading focuses on how price behaves through market structure, support and resistance, breakouts, pullbacks, candlesticks and changes in momentum.
- Chart price action should usually be read first because it defines the broader market condition, important zones and whether the setup favors continuation, reversal or no trade.
- Candle price action is most useful after the wider context is clear. Rejection candles, engulfing patterns, inside bars and other formations can help confirm timing, but they are not complete strategies by themselves.
- Support and resistance are generally better treated as zones than exact prices. A pattern becomes more meaningful when it forms at a well-defined area that has already influenced price.
- A complete price action setup should include context, location, structure, a clear trigger, an invalidation level, a realistic target and an appropriately sized position.
- Breakouts, retests and reversal patterns should be confirmed through closing behavior and follow-through rather than assumed from a temporary wick or an incomplete formation.
- Price action does not eliminate false signals, execution costs or market risk. Written rules, historical review, forward testing and disciplined risk management are essential.
- When structure is unclear, price is poorly positioned or the potential reward does not justify the risk, choosing not to trade is part of the strategy.
What is Price Action Trading?
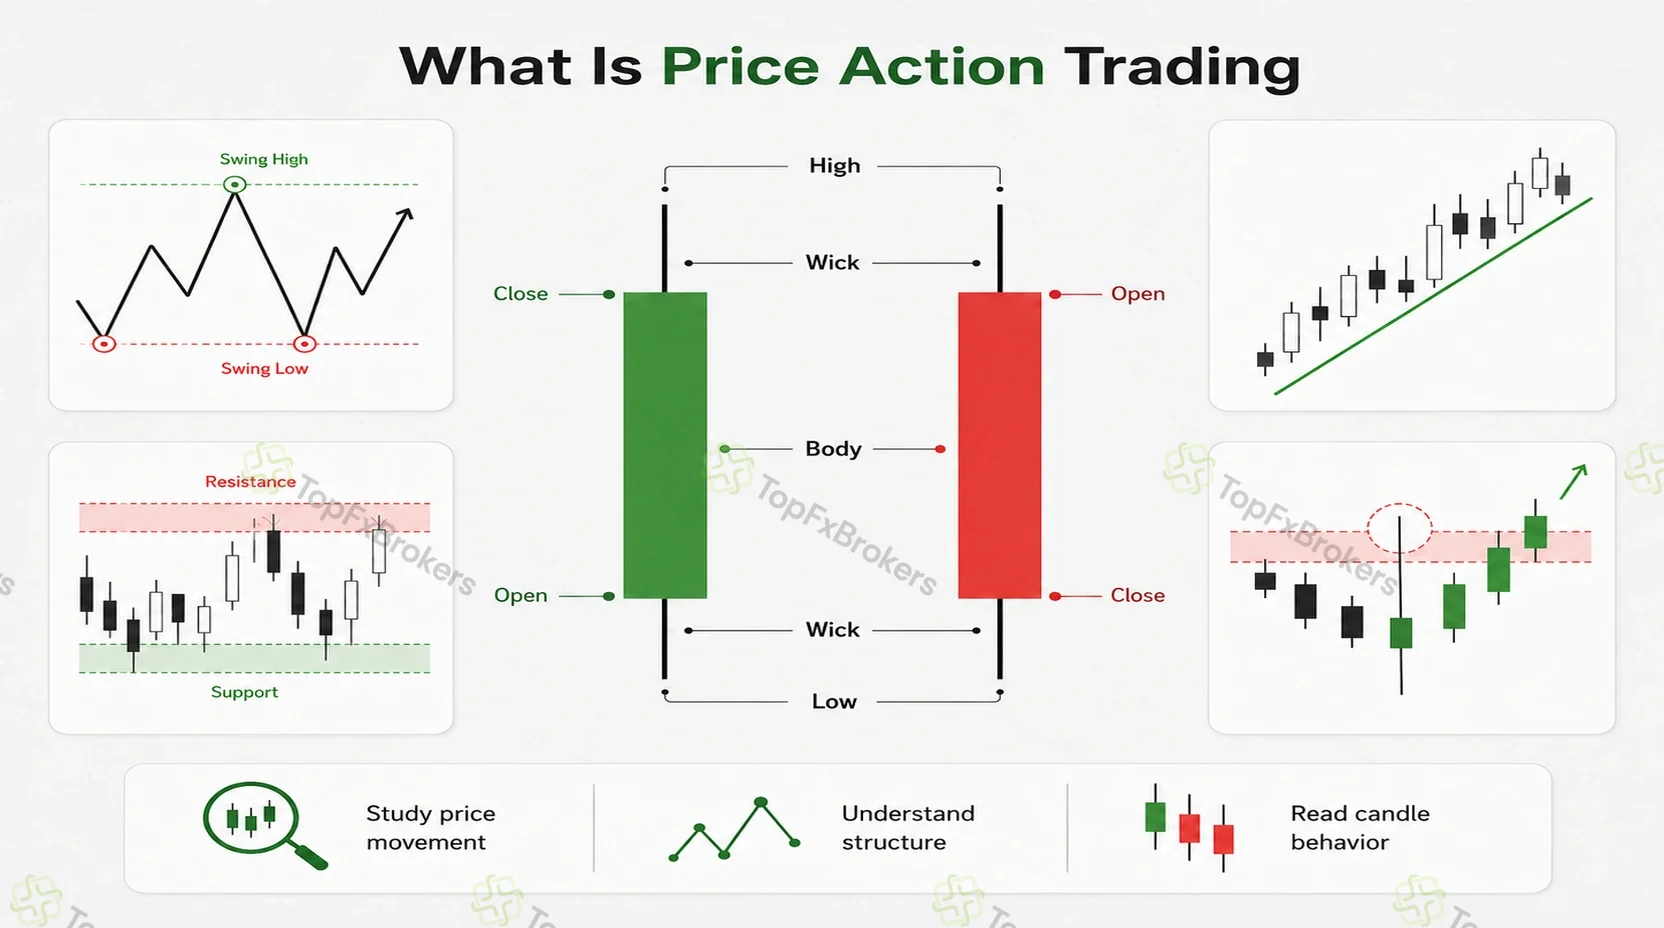
Price action trading is a form of technical analysis based on current and historical price movement. A trader may examine candlesticks, swing highs, swing lows, support and resistance, trends, ranges and recurring formations to understand what the market is doing. It is also sometimes described as naked trading, pure price action or clean-chart trading, although traders may still use limited supporting tools when those tools serve a clearly defined purpose.
Each candlestick records the opening price, closing price, highest price and lowest price for a selected period. Together, candles show more than whether price moved up or down. Their bodies, wicks, size, closing position and relationship with surrounding candles may reveal momentum, rejection, hesitation or compression.
However, a candle should not be treated as an isolated prediction. A long lower wick may show that price was rejected from a lower area, but that does not automatically make it a buying signal. The surrounding structure, location and next reaction still matter.
Price action is best understood as a way of organizing evidence rather than predicting the future with certainty.
Price Action and Technical Indicators
Price action trading is sometimes described as the complete rejection of technical indicators. That interpretation is unnecessarily restrictive.
A trader can place price at the center of the analysis while using a limited supporting tool, such as volume, an average price or a volatility measure. The important distinction is whether the tool supports the reading of price or replaces it.
A chart filled with overlapping indicators may create conflicting signals and make the underlying structure harder to see. Removing every indicator, however, does not automatically make a strategy objective or effective. A practical approach is to begin with a clean chart and add another tool only when it answers a specific question that price alone does not answer clearly.
Charting and Analysis Tools
Charting software does not create an advantage by itself, but it can make a price action process easier to apply consistently. Candlestick and OHLC bar charts preserve the open, high, low and close needed for detailed analysis, while a line chart can sometimes make broader closing-price structure easier to see. Alternative chart types that smooth or transform price may reduce visual noise, but they should not be confused with the exact traded prices shown by standard candles.
Useful functions include horizontal zones, rectangles, trendlines, measurement tools, multi-timeframe layouts, alerts and chart replay. Watchlists and screeners can help identify markets approaching important areas, and replay tools can support testing without revealing every future candle at once. Automated pattern-recognition tools may locate possible formations, but they should be treated as search aids rather than proof that a valid setup exists.
Volume and Order Flow as Supporting Context
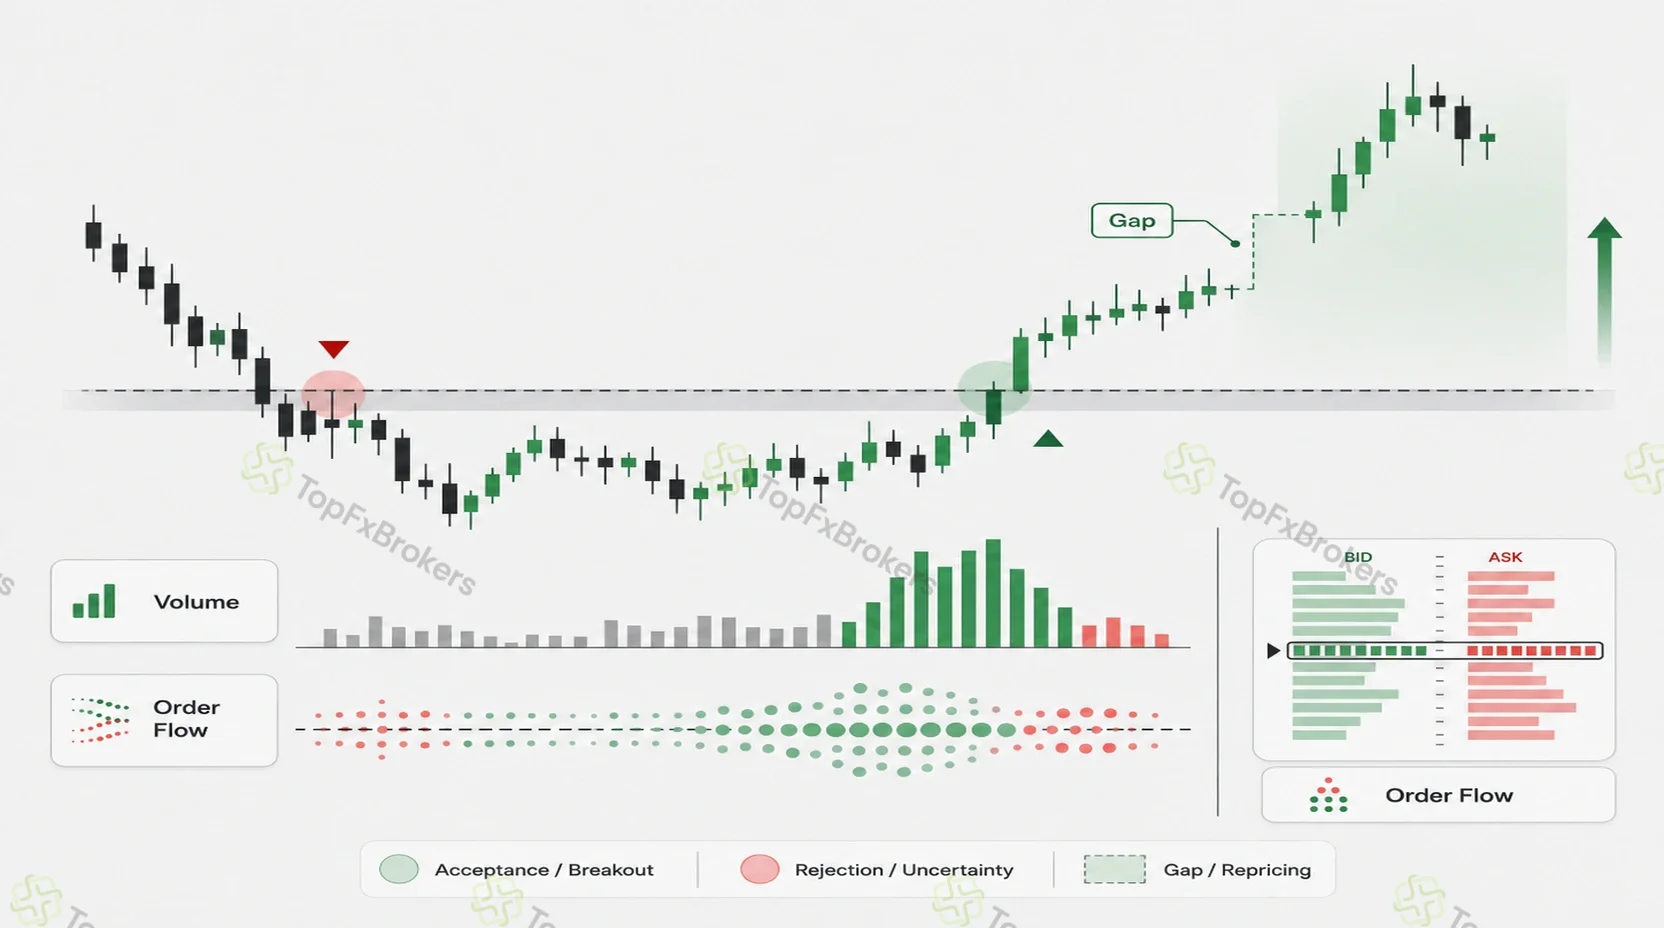
Volume shows how much trading activity occurred during a period, but it does not explain direction on its own. Rising activity during a breakout may support the view that participation has increased, while declining activity during a pullback may suggest that the countertrend move lacks commitment. These observations remain contextual: high volume can appear during continuation, exhaustion or forced liquidation.
The meaning of volume also depends on the market and data source. Exchange-traded markets can provide centralized transaction volume, whereas decentralized markets may display tick volume or data that reflects only a particular provider. Comparisons should therefore use a consistent source and focus on relative changes rather than treating every displayed number as the complete market total.
Order flow examines executed transactions and available liquidity more closely. Depending on the market and platform, traders may use time-and-sales data, bid-and-ask activity, market depth, footprint charts or volume-at-price information. These tools can help assess whether price is being accepted or rejected around a level, but they can be noisy and are not required for the framework in this guide. Price gaps can also reveal abrupt repricing, especially in markets with defined closing hours, although a gap still needs to be interpreted through current structure and risk.
What Price Action Can and Cannot Show
Price action can help identify momentum, rejected prices, accepted prices, developing trends, consolidation, structural changes and areas where a trade may become invalid.
It cannot guarantee that support will hold, that a breakout will continue, that a candlestick formation will produce a reversal or that a historically effective setup will succeed on its next appearance.
The objective is not certainty. It is to find situations in which the available evidence supports a clear plan and the potential loss can be controlled.
The Five-Part Price Action Framework
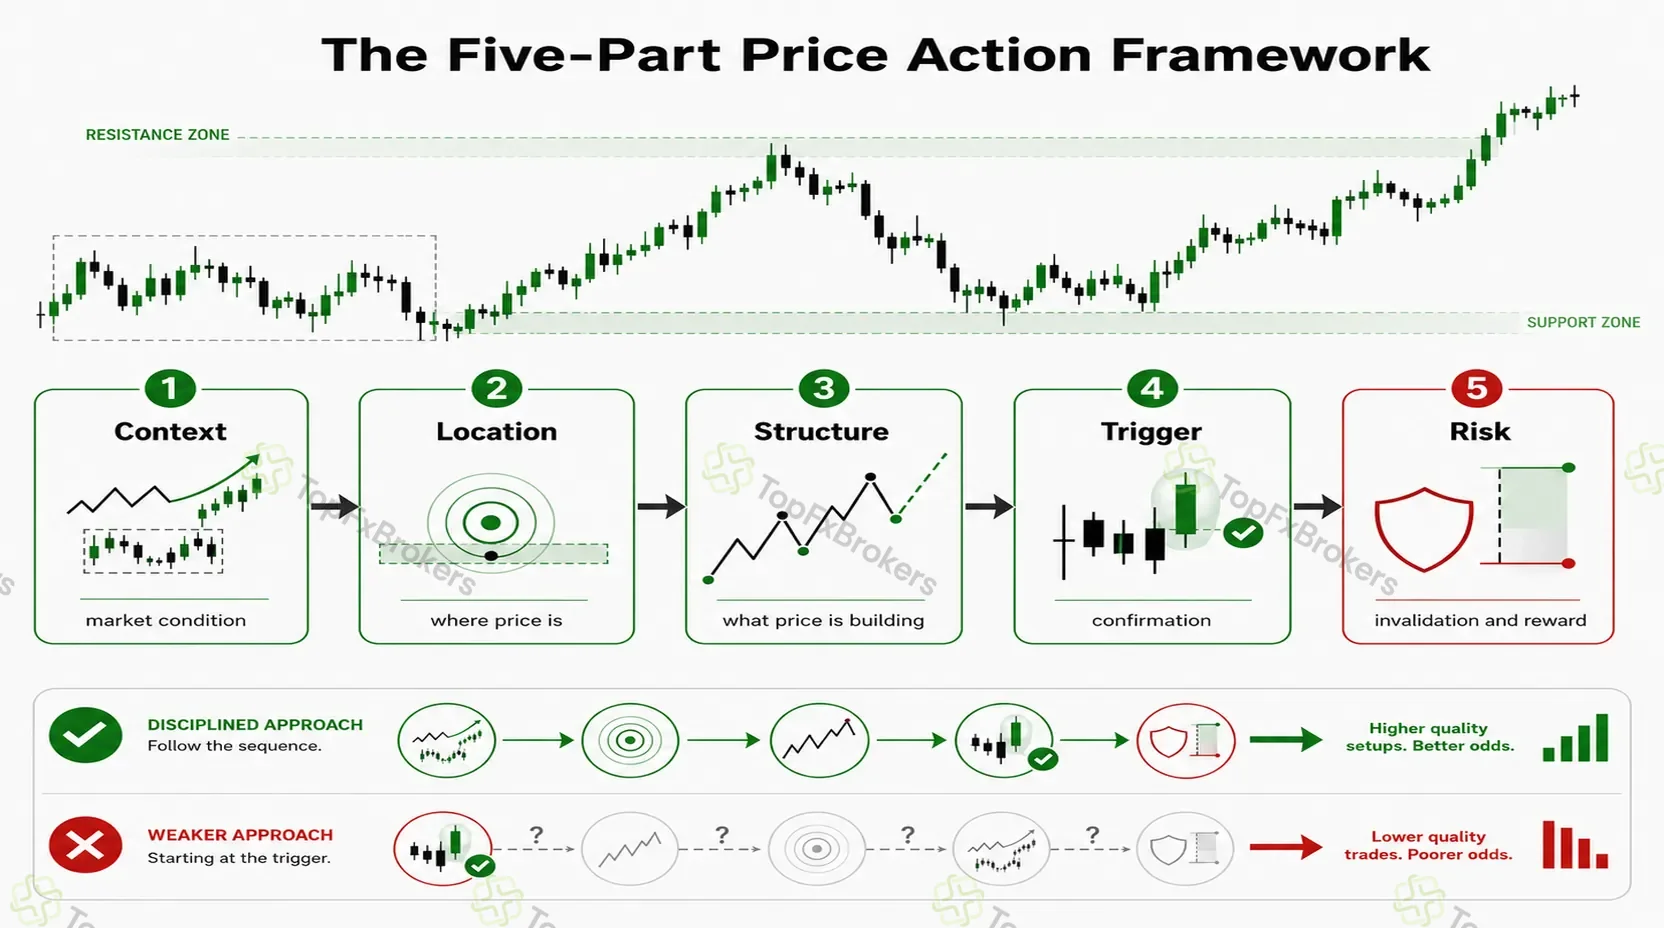
A practical price action analysis can be organized into five connected stages:
| Stage | Main question | What the trader examines |
|---|---|---|
| Context | What condition is the market in? | Trend, range, compression, transition or disorderly movement |
| Location | Where is price now? | Support, resistance, swing points, breakout levels and range boundaries |
| Structure | What is price building? | Highs and lows, impulses, corrections, failed moves and structural breaks |
| Trigger | What confirms the trade idea? | Rejection, engulfing close, retest, candle break or renewed momentum |
| Risk | Where is the idea wrong, and is the trade worthwhile? | Stop placement, target, position size, execution costs and available space |
These stages should normally be considered in order.
Beginning with a trigger often leads to weak decisions. A trader notices a hammer, engulfing candle or inside bar and then searches the chart for reasons to justify it. Beginning with context and location creates a more disciplined process. The trader first identifies what type of opportunity would make sense and then waits to see whether price confirms it.
This framework can be applied to different markets and holding periods, although the timeframe, volatility and execution conditions will affect how each setup is managed.
How to Read Market Conditions
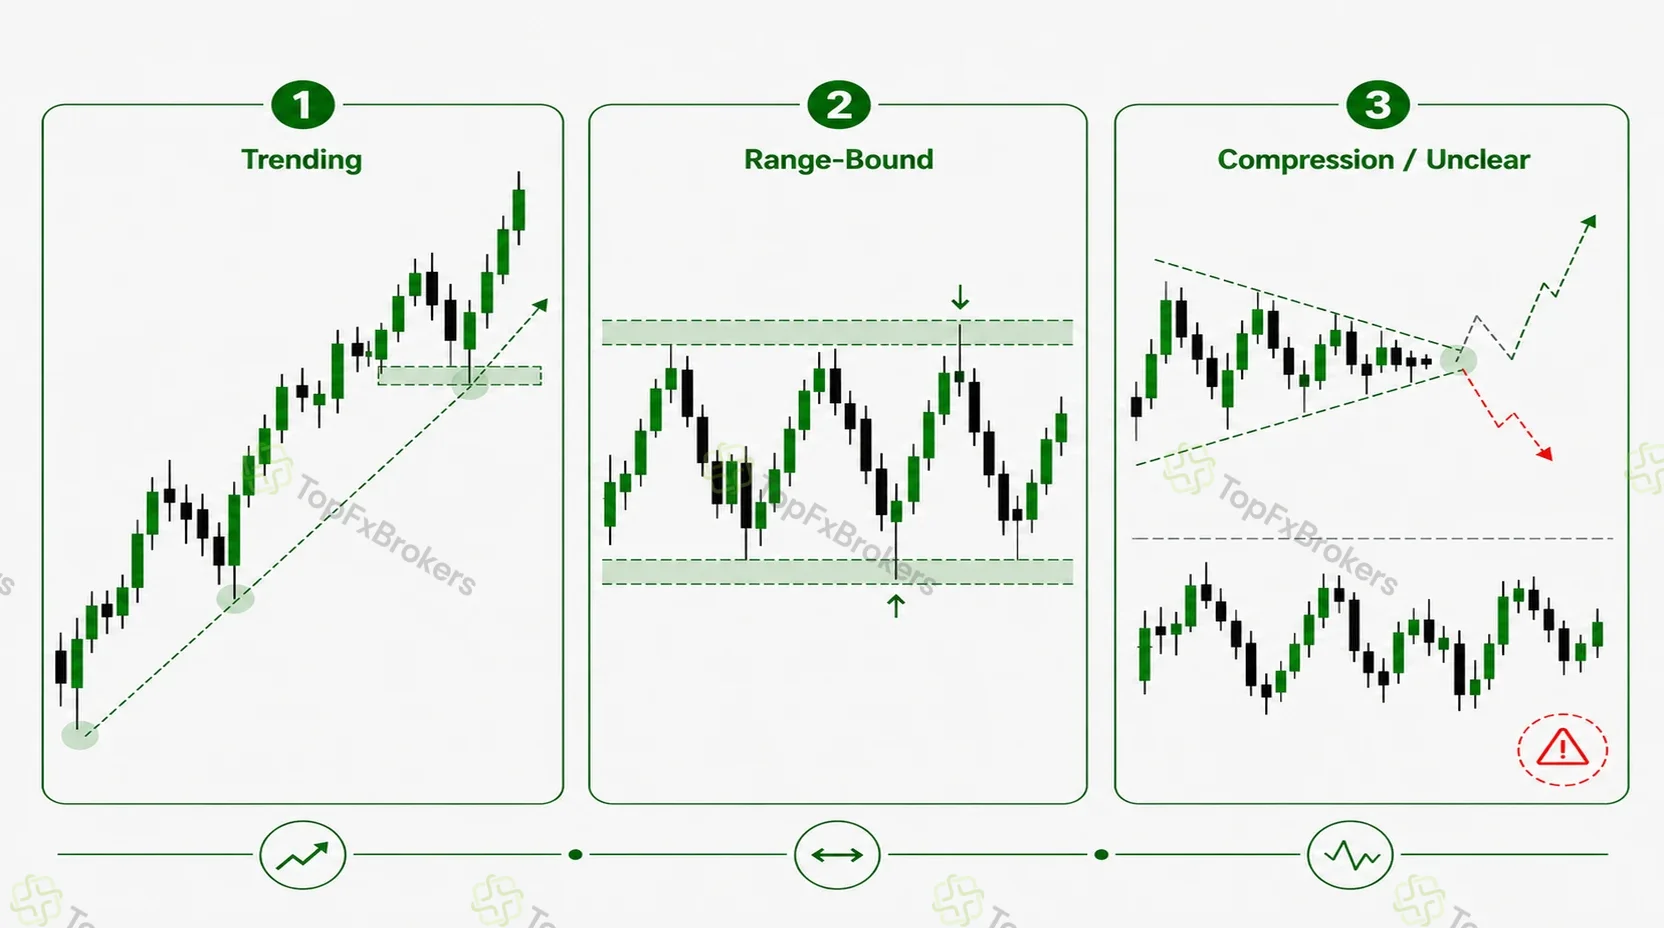
Price action should not be interpreted in the same way in every environment. A rejection signal that is useful at the boundary of a range may be weak in a strong directional move. A breakout method may suit a compressed market but become unattractive after price has already travelled far from the structure.
Trending Markets
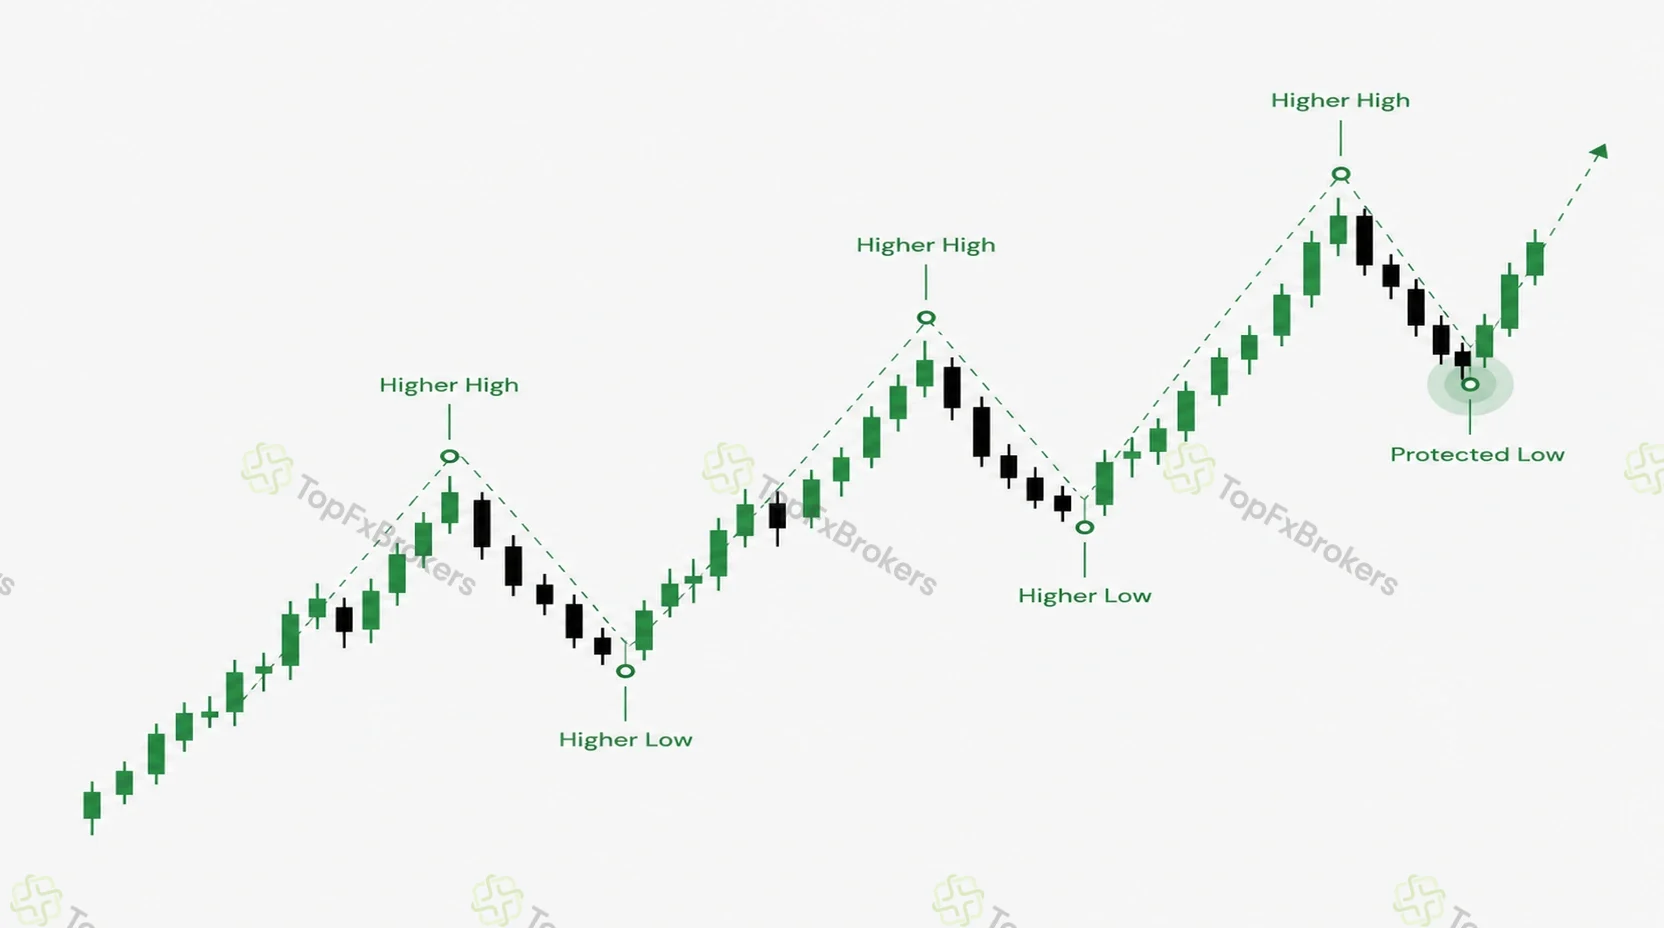
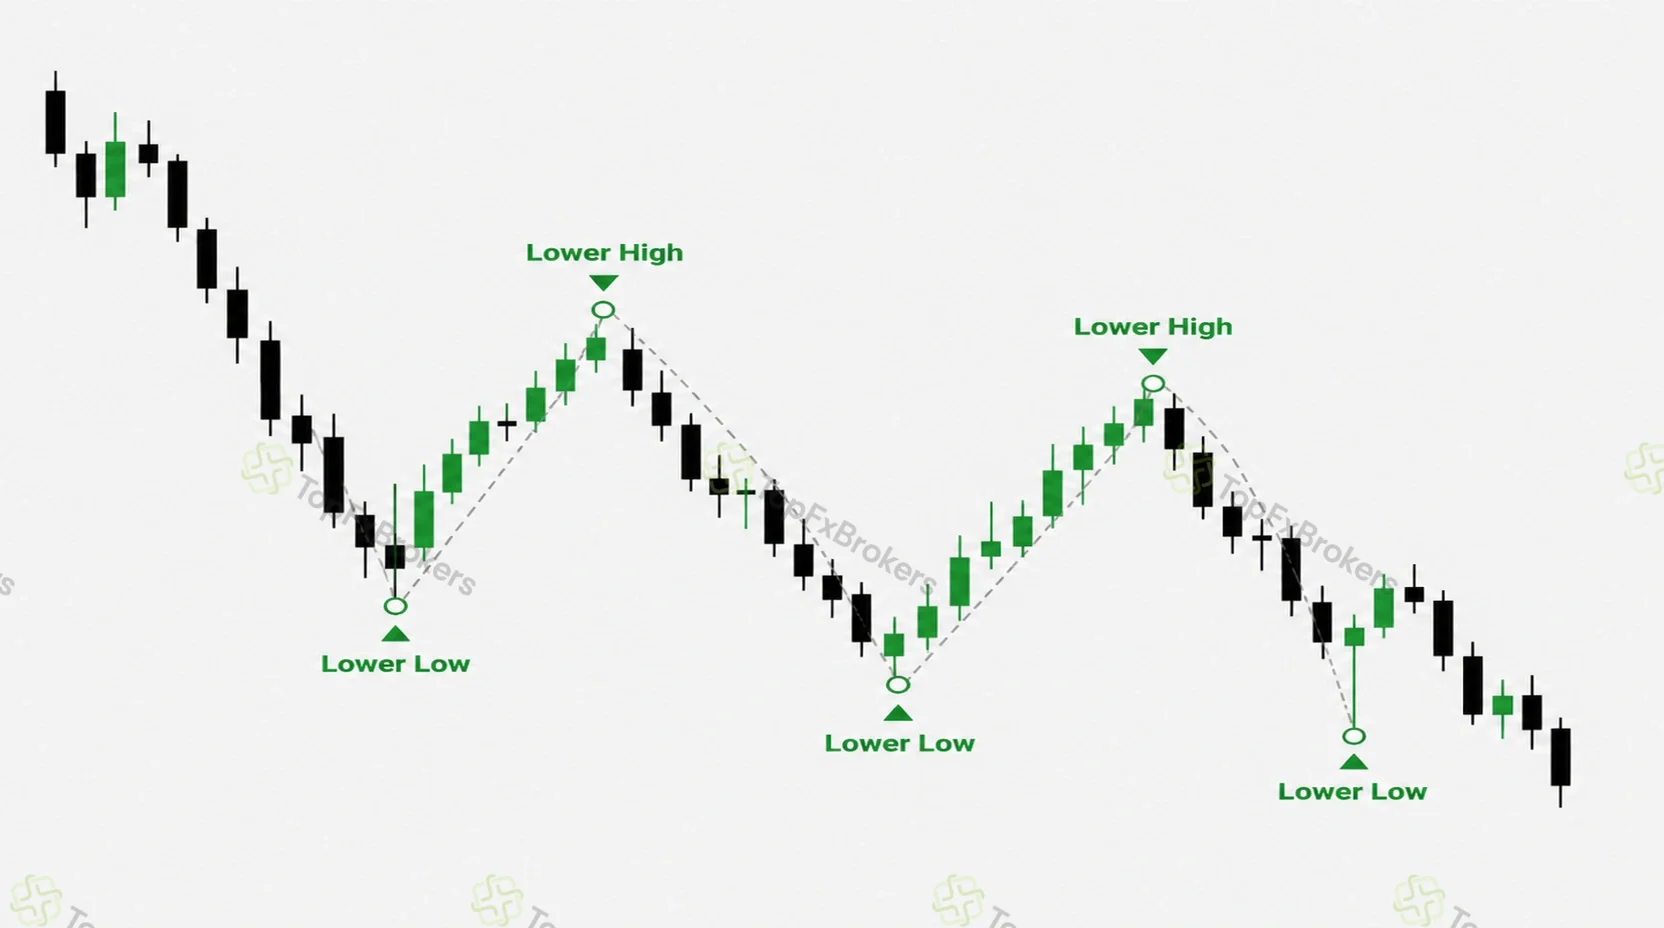
An uptrend generally contains higher swing highs and higher swing lows. A downtrend generally contains lower swing highs and lower swing lows.
The swings do not need to be perfectly symmetrical. Real trends include consolidations, deeper pullbacks and temporary breaks of minor levels. The broader question is whether buyers or sellers continue to protect the structural points that keep the trend intact.
In an uptrend, traders may watch for pullbacks toward former resistance, rising support or another established reaction area. In a downtrend, attention may shift toward rallies into former support, declining resistance or lower structural highs.
Trading in the direction of a trend does not remove risk. Trends can weaken, become extended or reverse abruptly, so every position still needs an invalidation point.
Range-Bound Markets
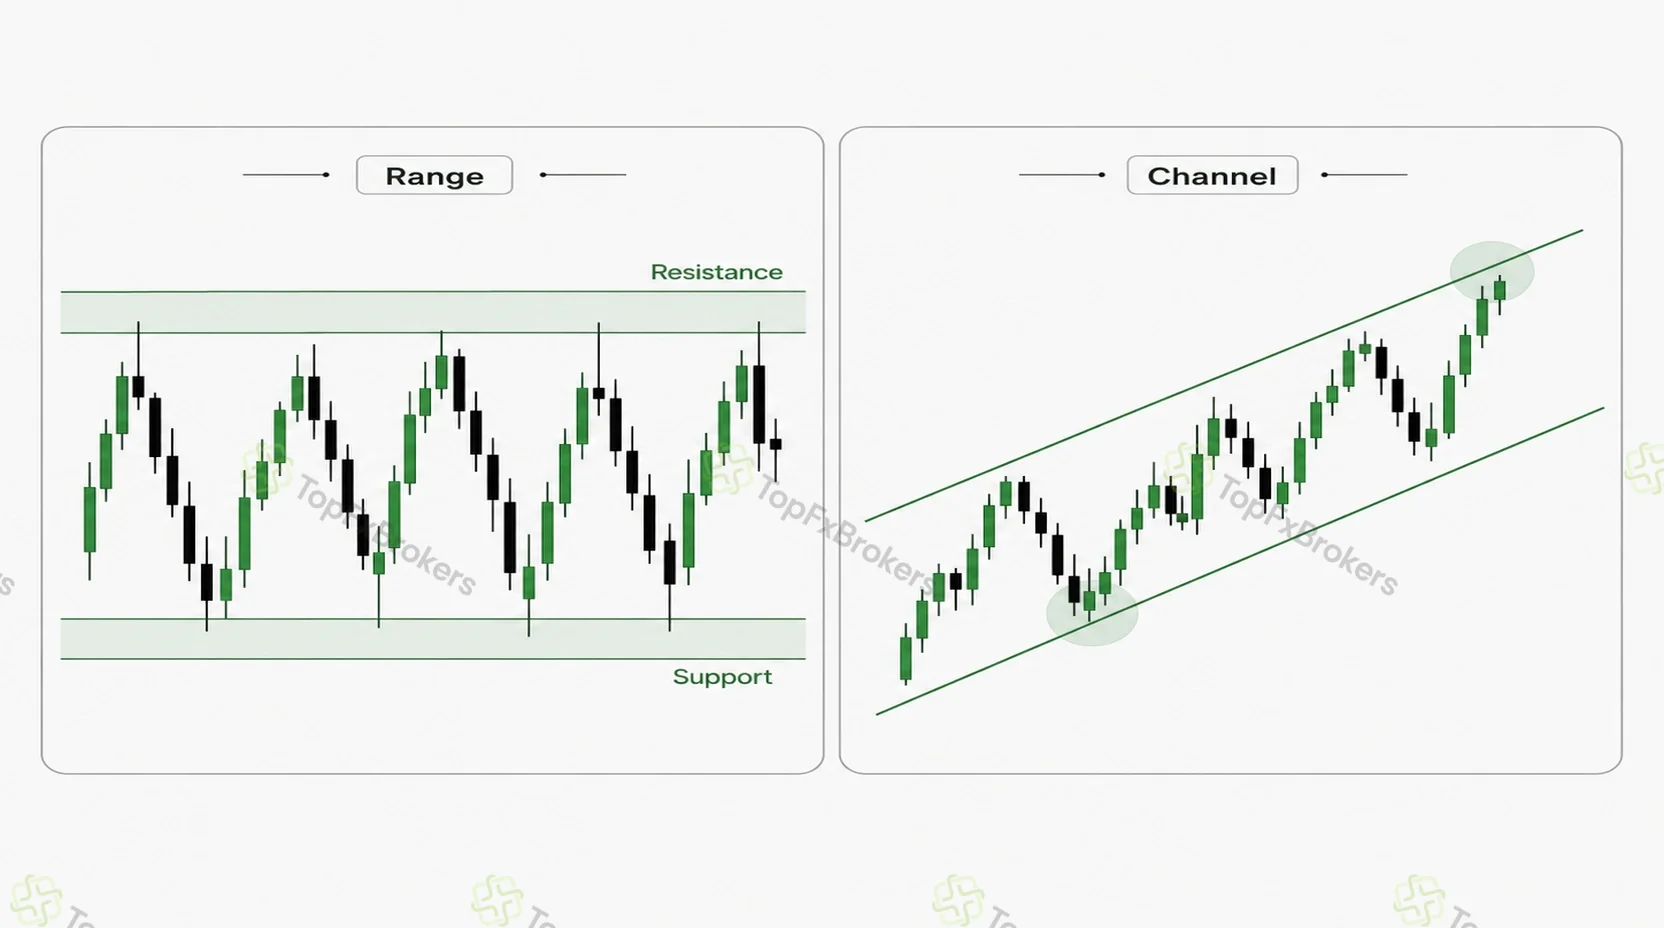
A range develops when price repeatedly moves between upper resistance and lower support without establishing a sustained direction.
The boundaries are usually more useful than the center. At the edges, a trader can observe whether price rejects the zone, briefly moves through it, returns inside or begins to close convincingly beyond it. The middle often offers weaker direction and less distance to the next obstacle.
Ranges eventually end. A range strategy therefore needs a clear condition that invalidates the assumption that the boundaries will continue holding.
Compression and Unclear Conditions
Compression occurs when price movement becomes progressively tighter. It may appear as a triangle, pennant, wedge or narrowing range. The market is temporarily balancing, but the shape does not guarantee which side will ultimately take control.
A more convincing breakout normally includes a decisive move beyond the boundary, a meaningful close and enough follow-through to show that price is being accepted outside the previous structure.
A market can also stop trending without forming a clean range. Swings become inconsistent, important areas fail repeatedly and candles expand in both directions. When several interpretations appear equally plausible, standing aside can be the most disciplined decision.
How Support and Resistance Shape Price Action
Support and resistance give price action its location. They mark areas where previous trading activity created a significant response and where future behavior may deserve closer attention.
Support is an area where declining price previously attracted enough buying interest to produce a reaction. Resistance is an area where rising price previously encountered enough selling interest to slow or reverse the move. These areas are not guaranteed barriers. They are locations where traders evaluate whether price rejects, accepts or moves through the available orders.
Identifying Meaningful Zones
Support and resistance are generally better treated as zones than exact prices. Price may react slightly above or below a previous turning point because spreads, volatility, order placement and market participation vary.
A useful zone may be drawn around the bodies and wicks of relevant candles, the base of a strong move or the price band surrounding an important swing. It should not be widened until almost every reaction fits inside it. A very wide zone weakens entry precision and makes invalidation difficult to define.
The quality of a zone may depend on reaction strength, recency, time spent in the area, the momentum of the departure and the number and quality of later tests. Repeated testing can confirm that a zone matters, but it can also absorb resting orders and make a later break more likely.
Role Reversals, Supply and Demand, and Confluence
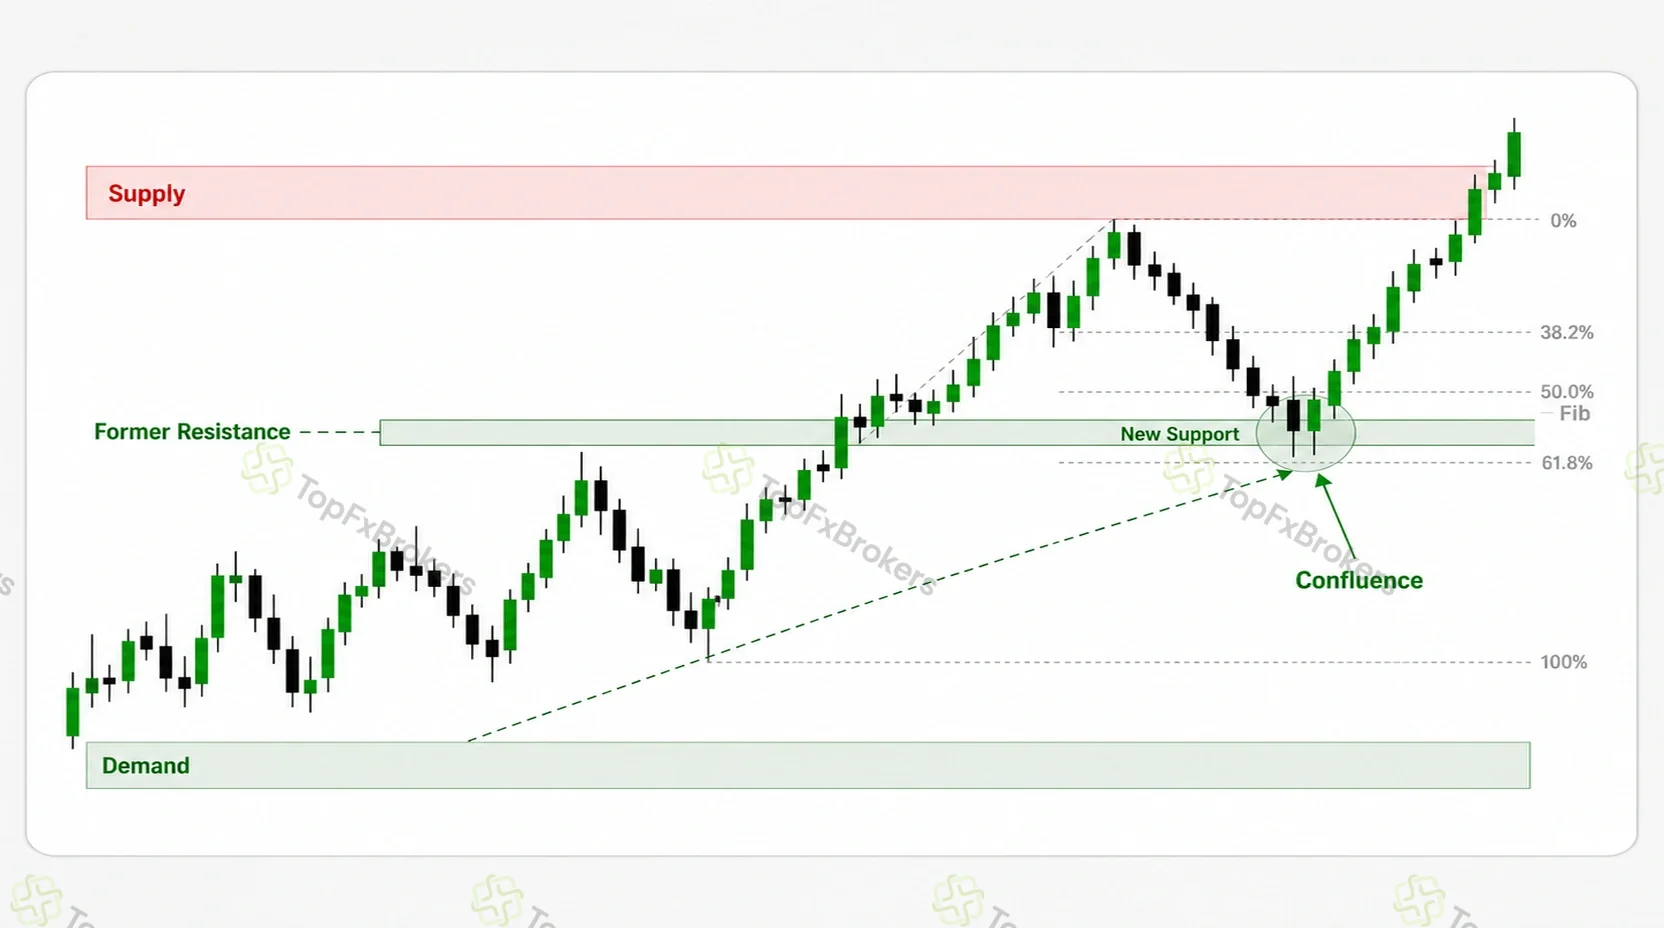
When resistance is broken, the area may later act as support. When support is broken, it may later act as resistance. This role reversal becomes more credible when price returns to the area and reacts in its new direction.
Supply and demand zones describe a similar idea from a broader perspective. A demand zone is an area from which price previously moved higher with strength, while a supply zone is an area from which price moved lower. These zones can help identify where an imbalance may have started, but they should still be assessed through current structure and reaction quality.
Confluence exists when several independent observations support the same trade idea. A pullback may reach former resistance that has become support, align with a broader uptrend and produce a bullish rejection. A Fibonacci retracement may also be used as supporting context, but it should not replace the underlying market structure or zone.
Confluence should improve the reasoning rather than simply increase the number of marks on the chart.
Trendlines and Fibonacci as Supporting Tools
A trendline connects meaningful swing points to show the direction and pace of movement. It should not be forced through minor candles simply to fit a preferred view. Like horizontal support and resistance, a trendline is better treated as a reaction area than an exact barrier, and a break becomes more informative when it is accompanied by a change in swing structure or clear follow-through.
Fibonacci retracement tools may highlight commonly watched pullback areas, including the 38.2%, 50% and 61.8% regions. These levels do not create support or resistance by themselves. They are most useful when they overlap with an established zone, prior swing or broader structural feature. Trendlines and Fibonacci levels should support an existing price-based case rather than be used to rescue a setup that lacks clear context.
How to Read Chart Price Action
Chart price action concerns the broader structures created by multiple candles and swings. It helps traders determine whether the market is trending, ranging, compressing, continuing or beginning to change direction.
The chart should normally be read before an individual candle trigger. A well-formed candle pattern can still be weak when the surrounding structure is unclear or when it appears at an unimportant location.
Higher Highs and Higher Lows
Higher highs and higher lows are a common sign of bullish structure. Price advances to a new significant high and then forms a pullback that remains above the previous important low.
The higher low is especially important because it shows that buyers defended the trend during a correction. The structure begins to weaken when new highs become marginal, pullbacks deepen or an important higher low is broken decisively.
Lower Highs and Lower Lows
Lower highs and lower lows represent bearish structure. Price moves to a new significant low, while later rebounds fail below previous important highs.
The lower high shows that buyers could not recover the earlier level, while the lower low confirms that sellers extended the move. The structure becomes less dependable when price stops making meaningful lows or breaks and holds above an important lower high.
Breakouts and Retests
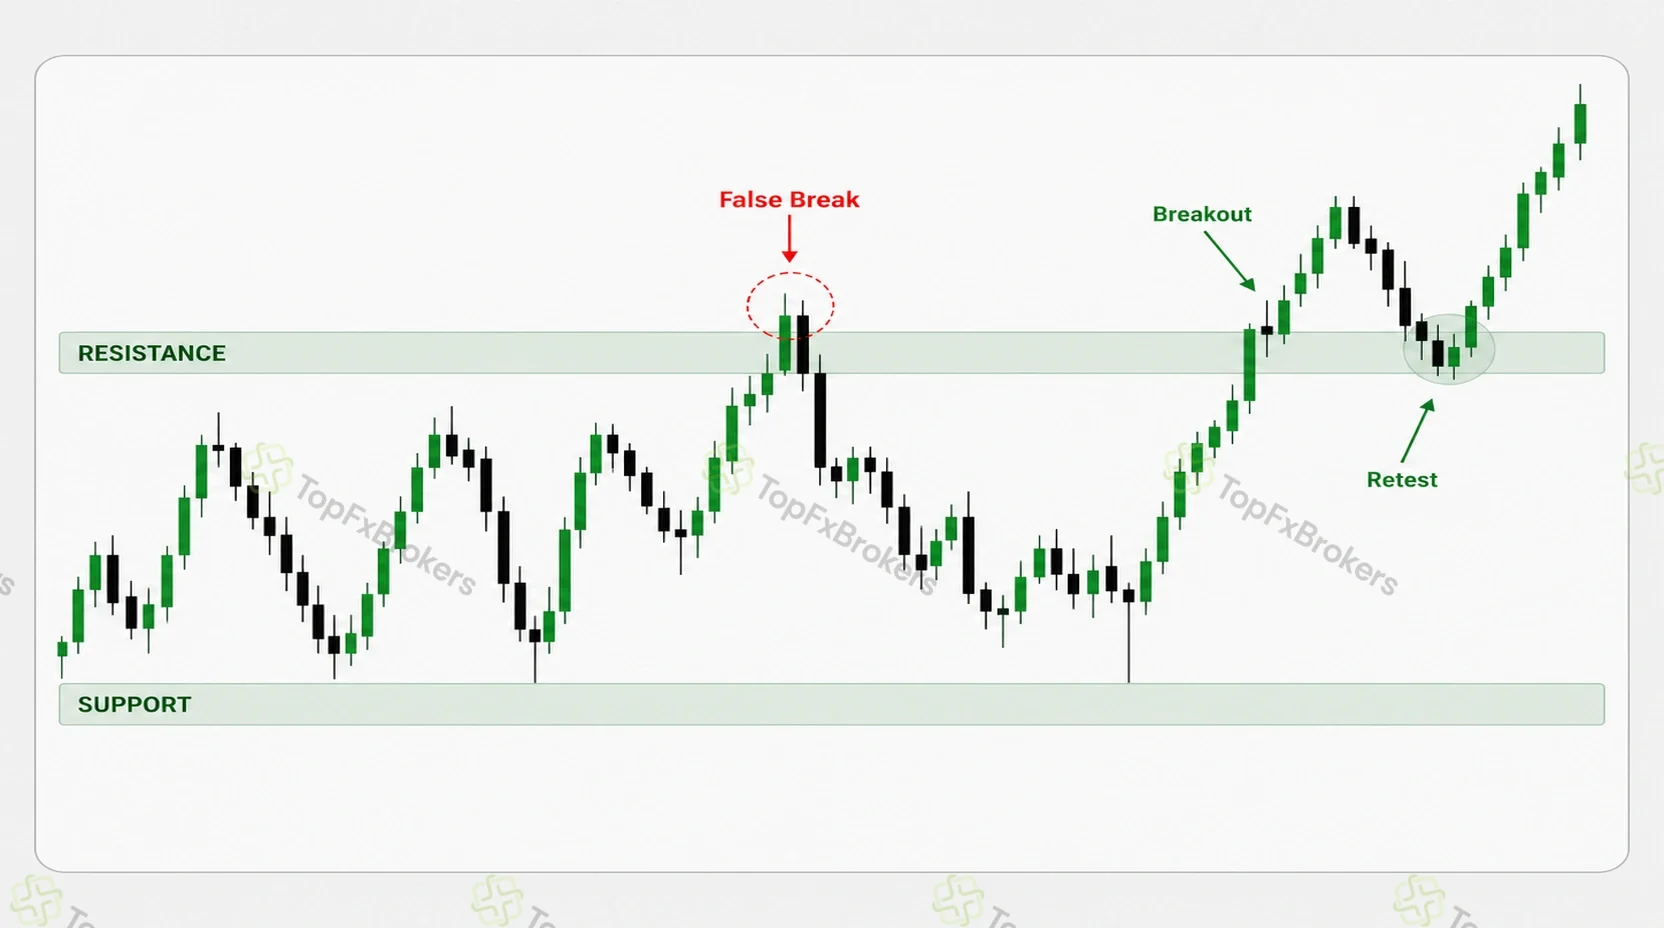
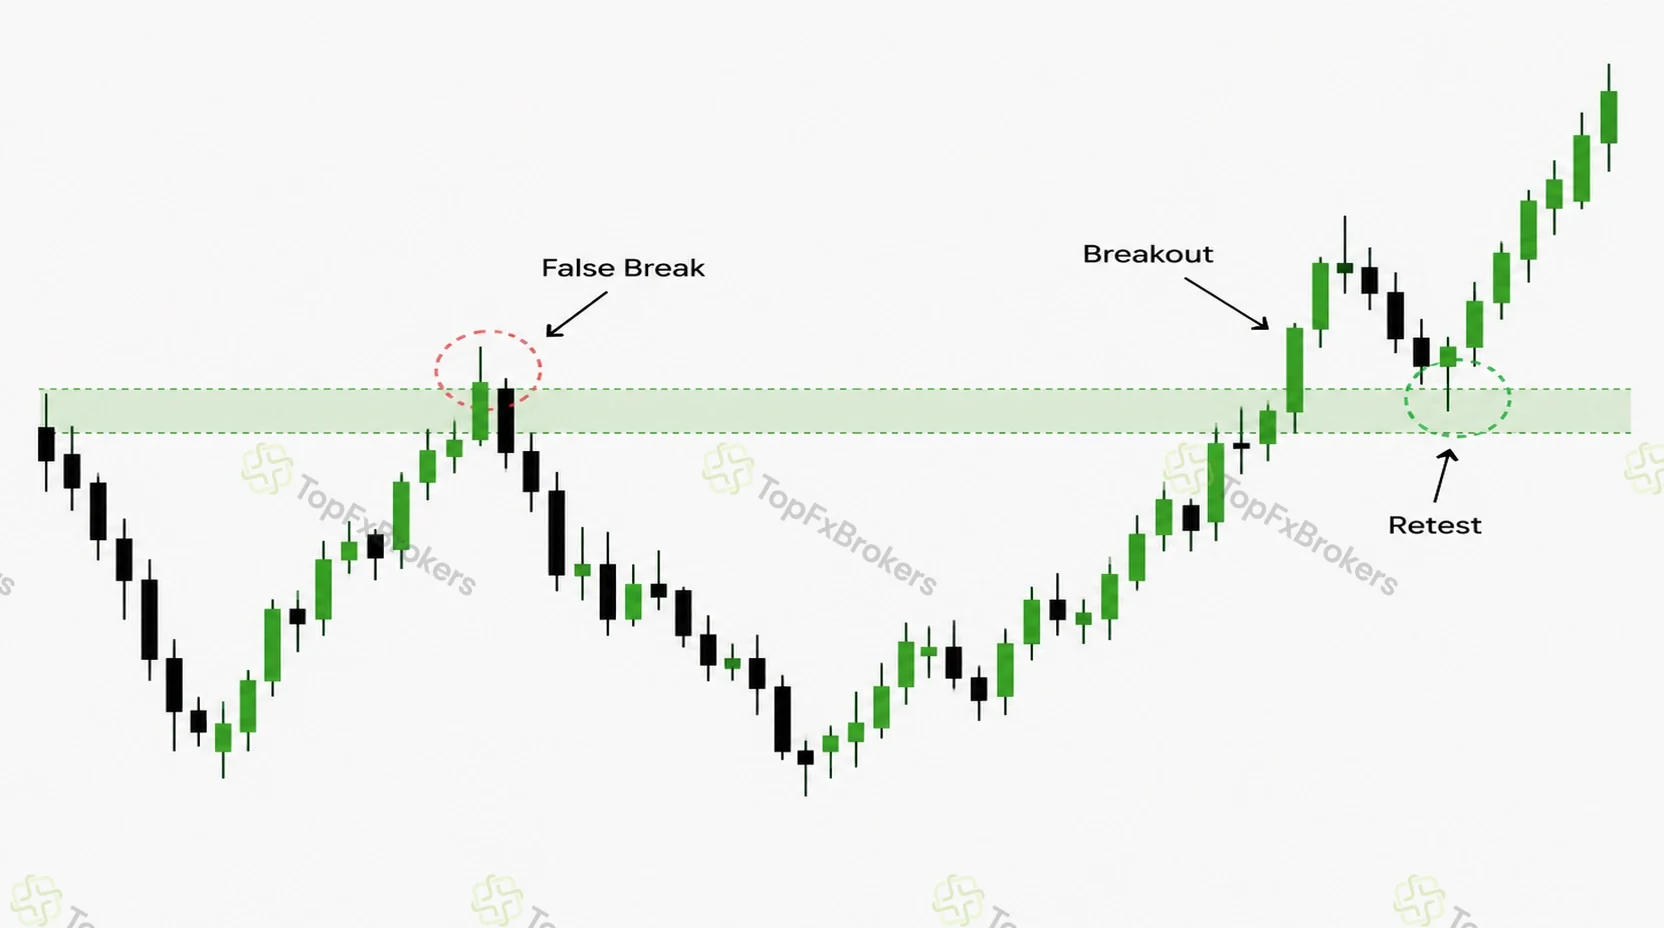
A breakout occurs when price moves beyond support, resistance or a consolidation boundary. A wick through a level is not necessarily enough. Traders may examine the quality of the close, the size of the move and whether later candles remain outside the previous structure.
A retest occurs when price returns to the broken area. Former resistance may begin acting as support, while broken support may begin acting as resistance. The retest is useful because it shows whether the market accepts the new role of the level.
False Breakouts
A false breakout occurs when price moves beyond an important boundary but cannot remain there. Price may break above resistance, attract breakout entries and then close back below the zone. It may also break below support and rapidly recover.
The failed move can reveal rejection outside the previous structure, but entry should normally wait until the failure is confirmed. A wick beyond the boundary can still develop into a genuine breakout.
Ranges and Channels
A range forms when price repeatedly moves between horizontal support and resistance. A channel contains roughly parallel boundaries that slope upward or downward.
Both structures help define possible reaction areas. In a range, attention usually focuses on the upper and lower boundaries rather than the center. In a channel, the lower boundary may act as a pullback area during an advance, while the upper boundary may act as a reaction or target area.
Neither boundary should be treated as an automatic reversal point. Price behavior at the area still matters.
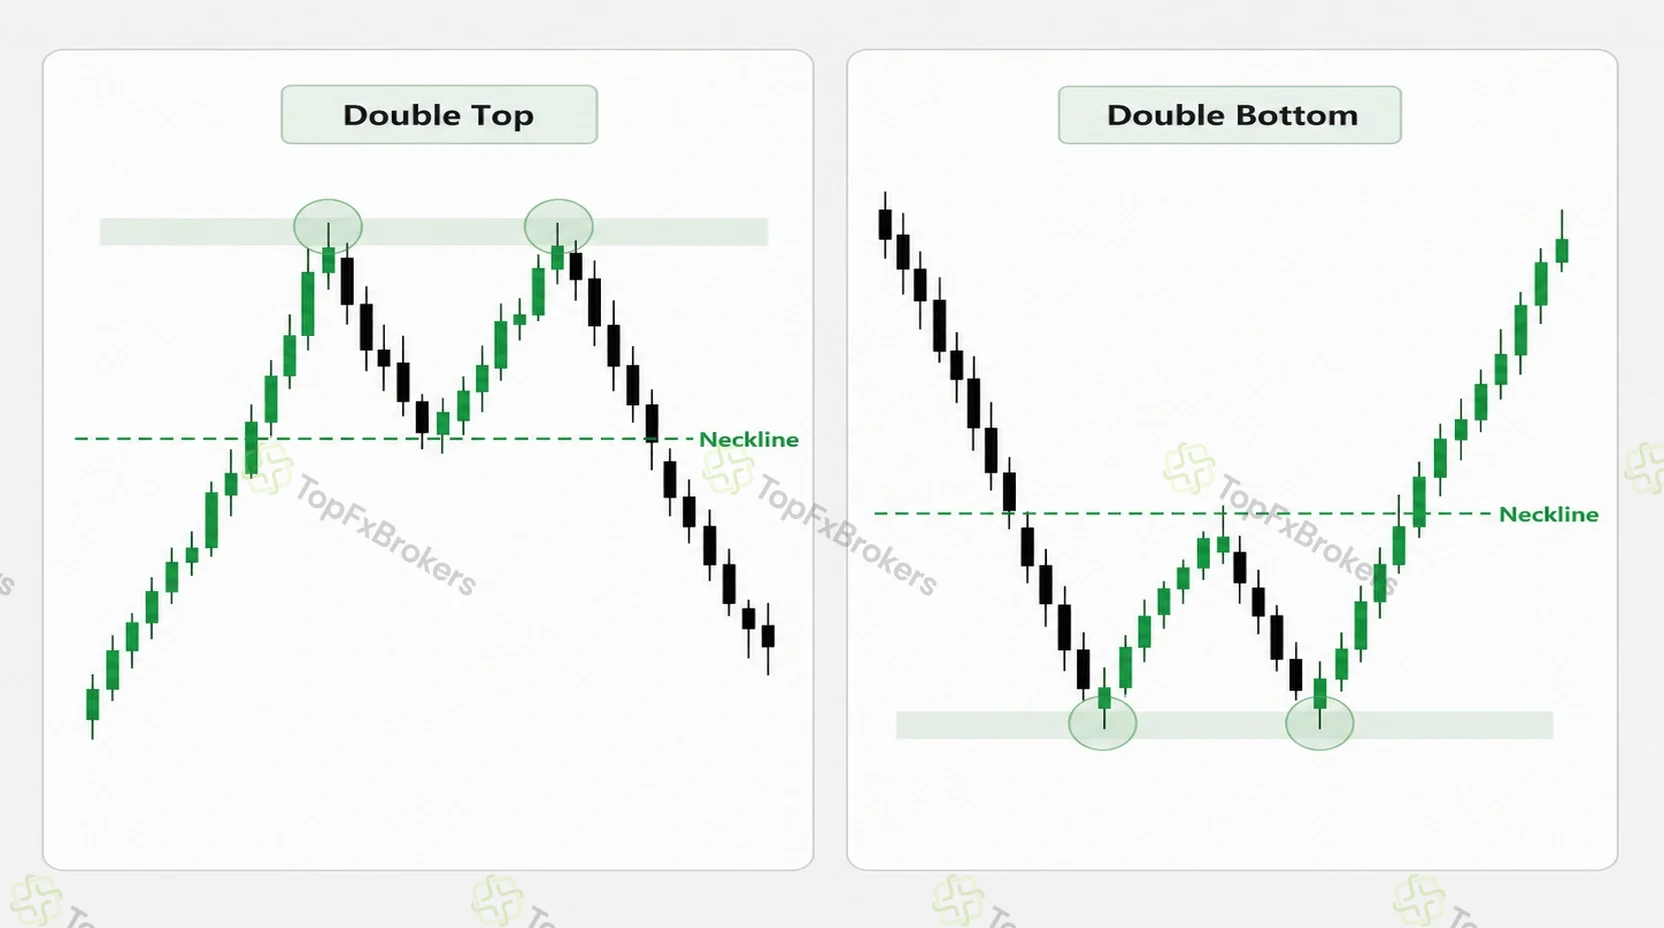
Double Tops and Double Bottoms
A double top develops when price tests a similar resistance area twice and fails to establish a sustained break. A double bottom forms when price tests a similar support area twice and cannot continue lower.
The second test may indicate weakening momentum, but two similar peaks or troughs do not confirm a reversal by themselves. Traders often watch the intervening swing level, sometimes called the neckline, for stronger evidence that the structure has changed.
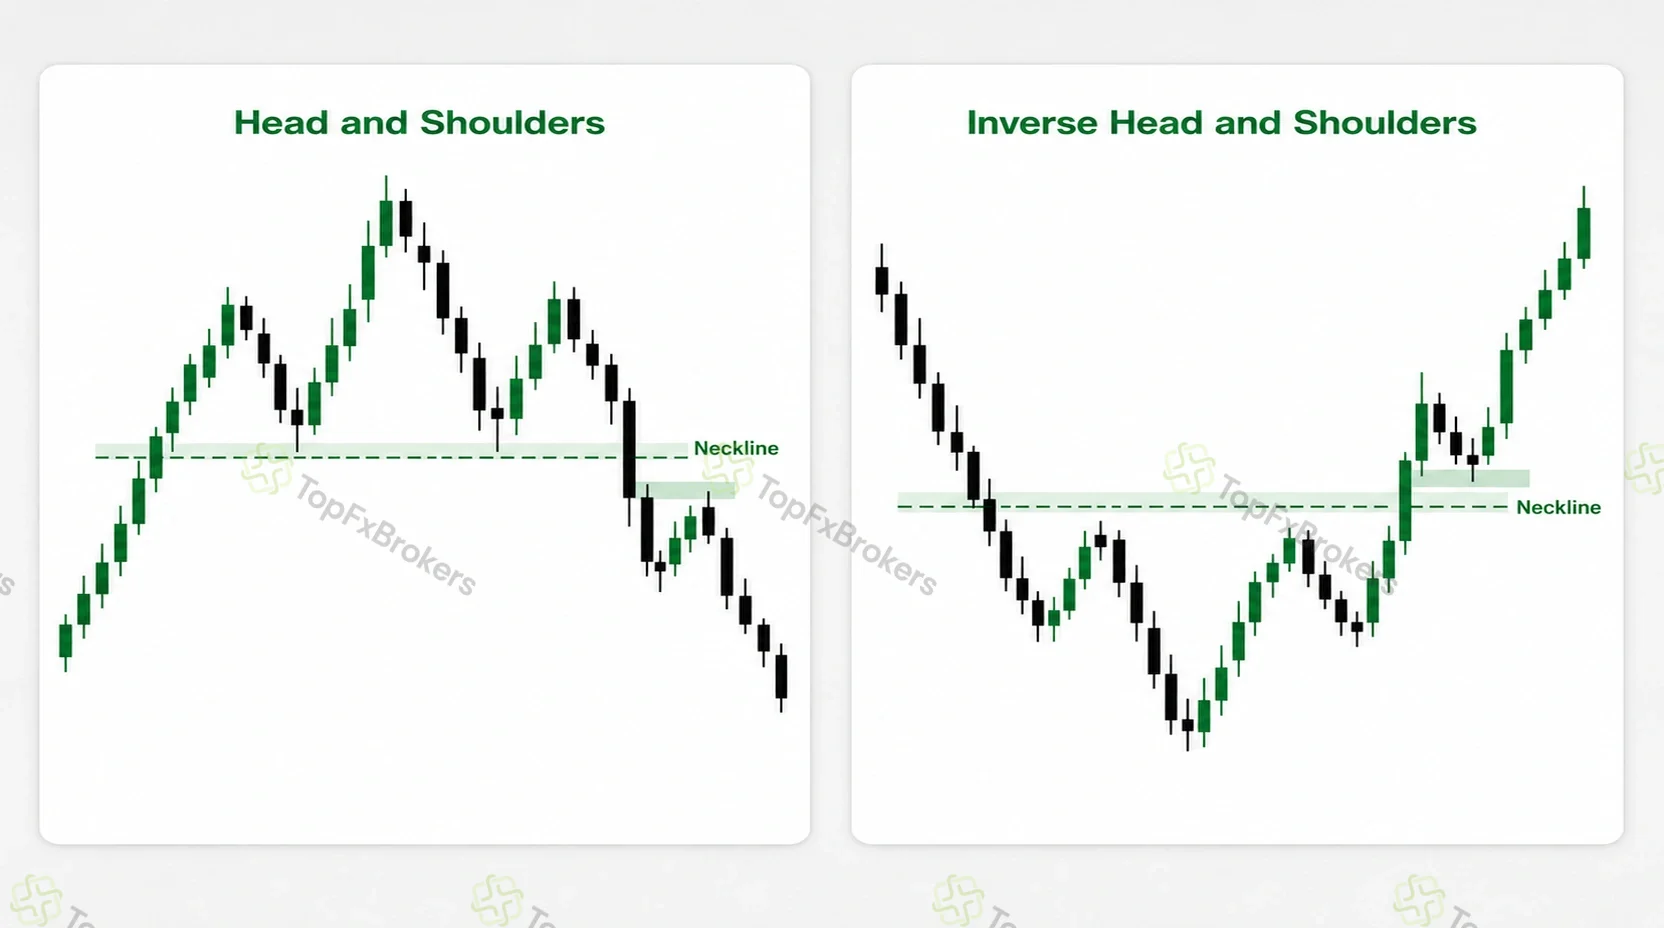
Head and Shoulders Patterns
A head and shoulders pattern usually develops after an upward move. It contains a left shoulder, a higher central peak and a right shoulder that fails below the head. The inverse version appears after a decline and contains three corresponding lows.
The neckline matters more than perfect symmetry. A break and unsuccessful retest of the neckline provide stronger evidence than the appearance of three peaks or troughs alone.
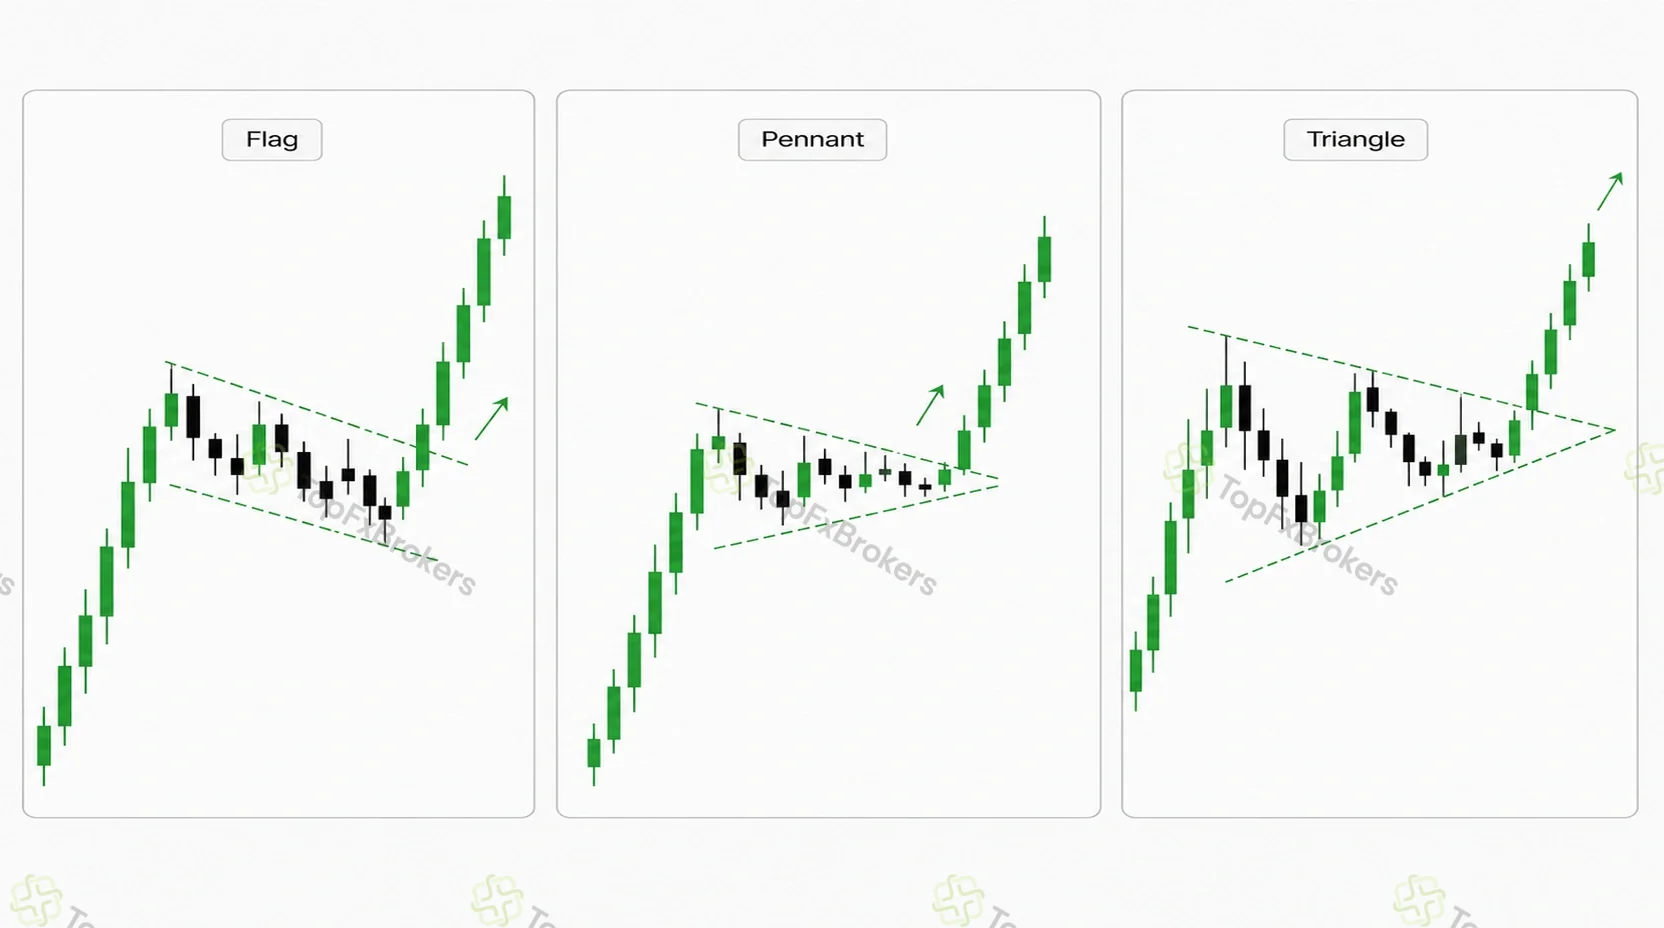
Flags, Pennants and Triangles
Flags, pennants and triangles are forms of pause or compression. A flag usually follows a strong impulse and forms as a controlled channel against that move. A pennant contracts into a small triangle after momentum. A broader triangle develops between converging boundaries.
These formations may support continuation, but the outcome should not be assumed before price breaks and holds beyond a boundary. If the correction damages important trend structure, the pattern may no longer represent a simple pause.
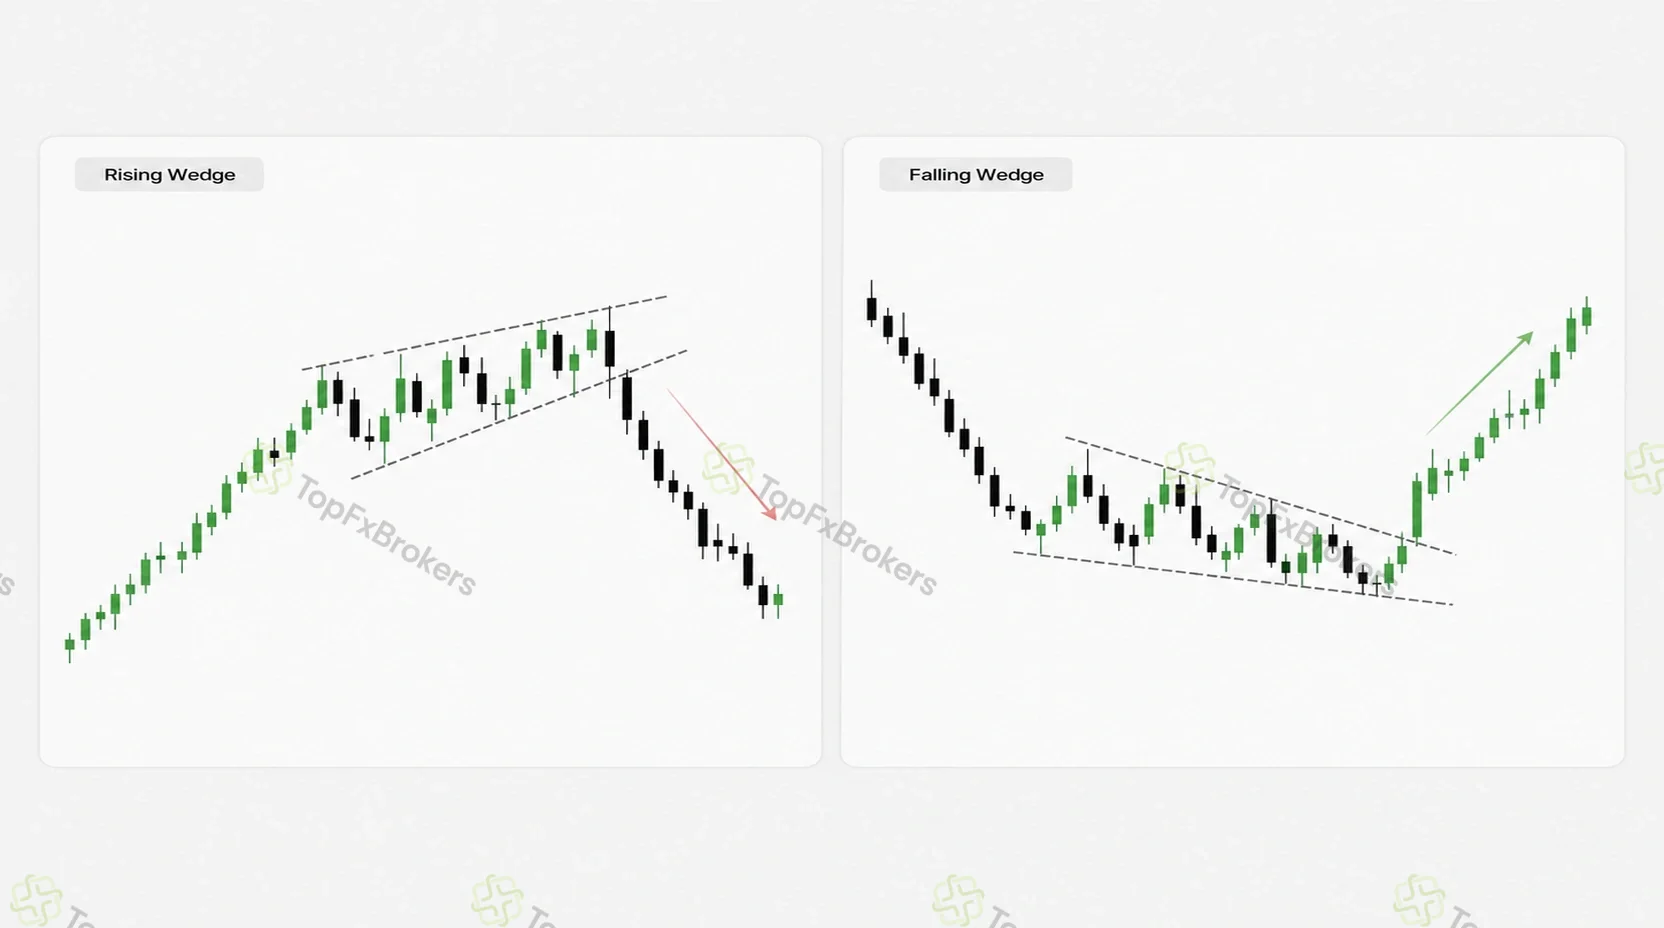
Wedges
A wedge forms when price continues moving in one broad direction while its swings become progressively tighter.
A rising wedge may show that upward progress is losing momentum, while a falling wedge may show weakening downward progress. Wedges can act as reversal or continuation formations depending on their location and the wider structure. The eventual boundary break and follow-through are more important than the shape alone.
How to Read Candle Price Action
Candle price action focuses on individual candles and short candle sequences. These formations provide short-term information about rejection, indecision, momentum and changes in pressure.
Candle patterns are normally most useful after the broader chart condition and relevant price area have already been identified. A candle can refine timing, but it should not carry the entire trade idea by itself.
Rejection Candles
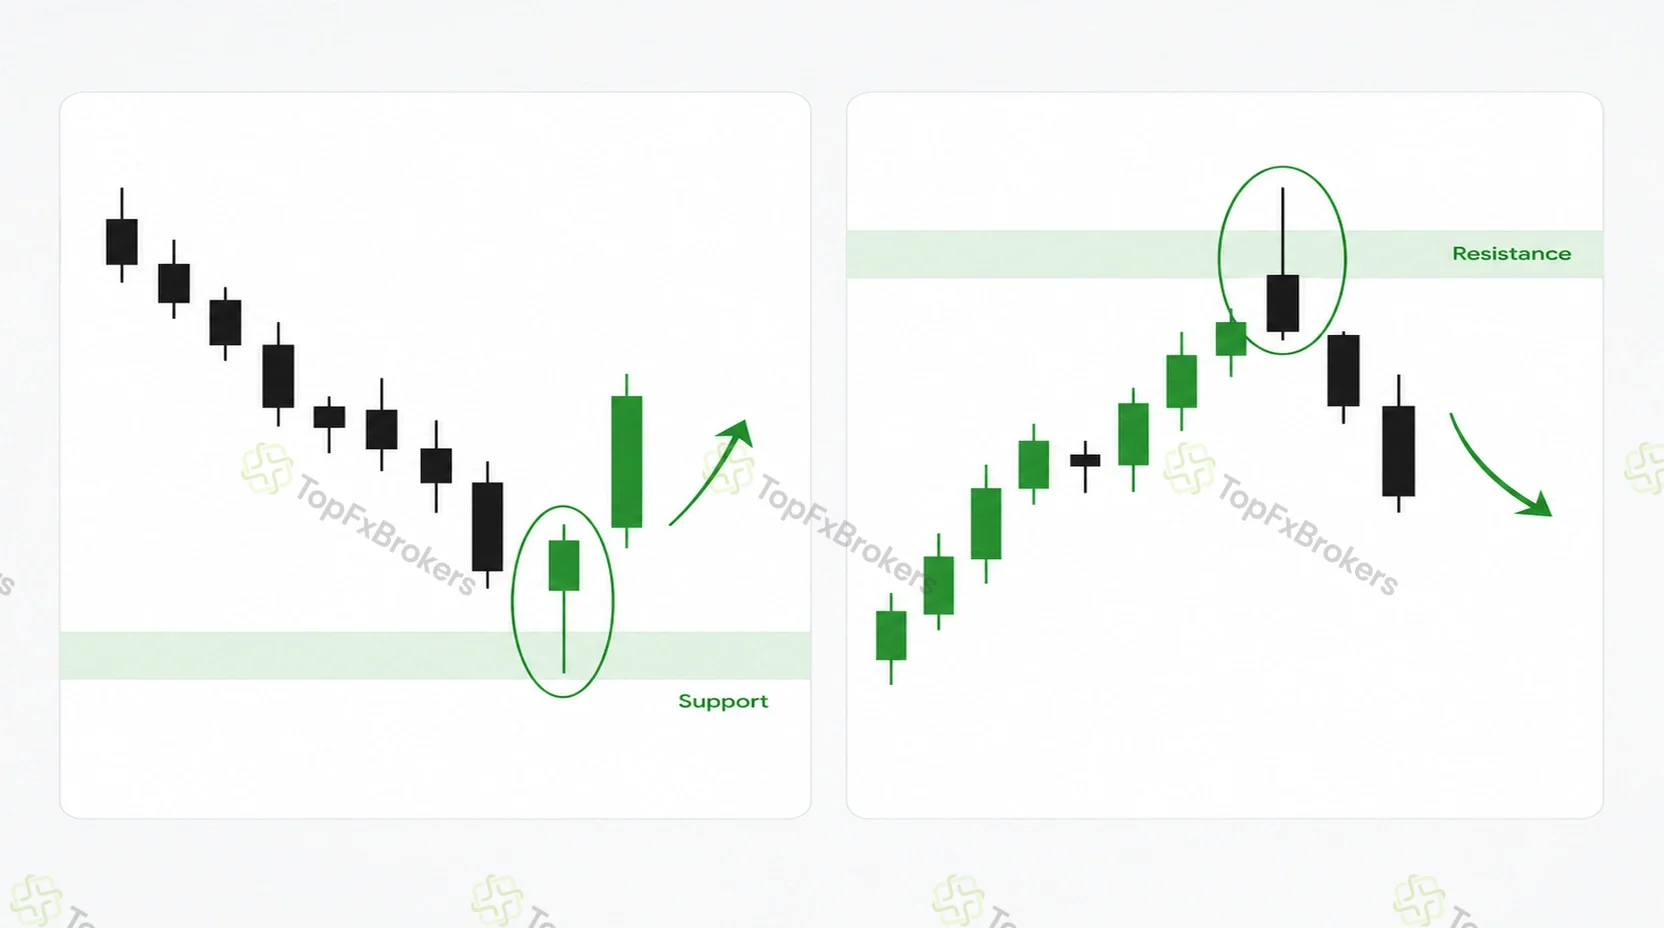
A rejection candle shows that price attempted to move in one direction but was pushed back before the candle closed.
A bullish rejection candle often has a longer lower wick and closes away from its low. A bearish rejection candle usually has a longer upper wick and closes below its high. The wick alone is not enough. The candle becomes more meaningful when it rejects support, resistance, a failed-break area or another established zone.
Hammer and Hanging Man
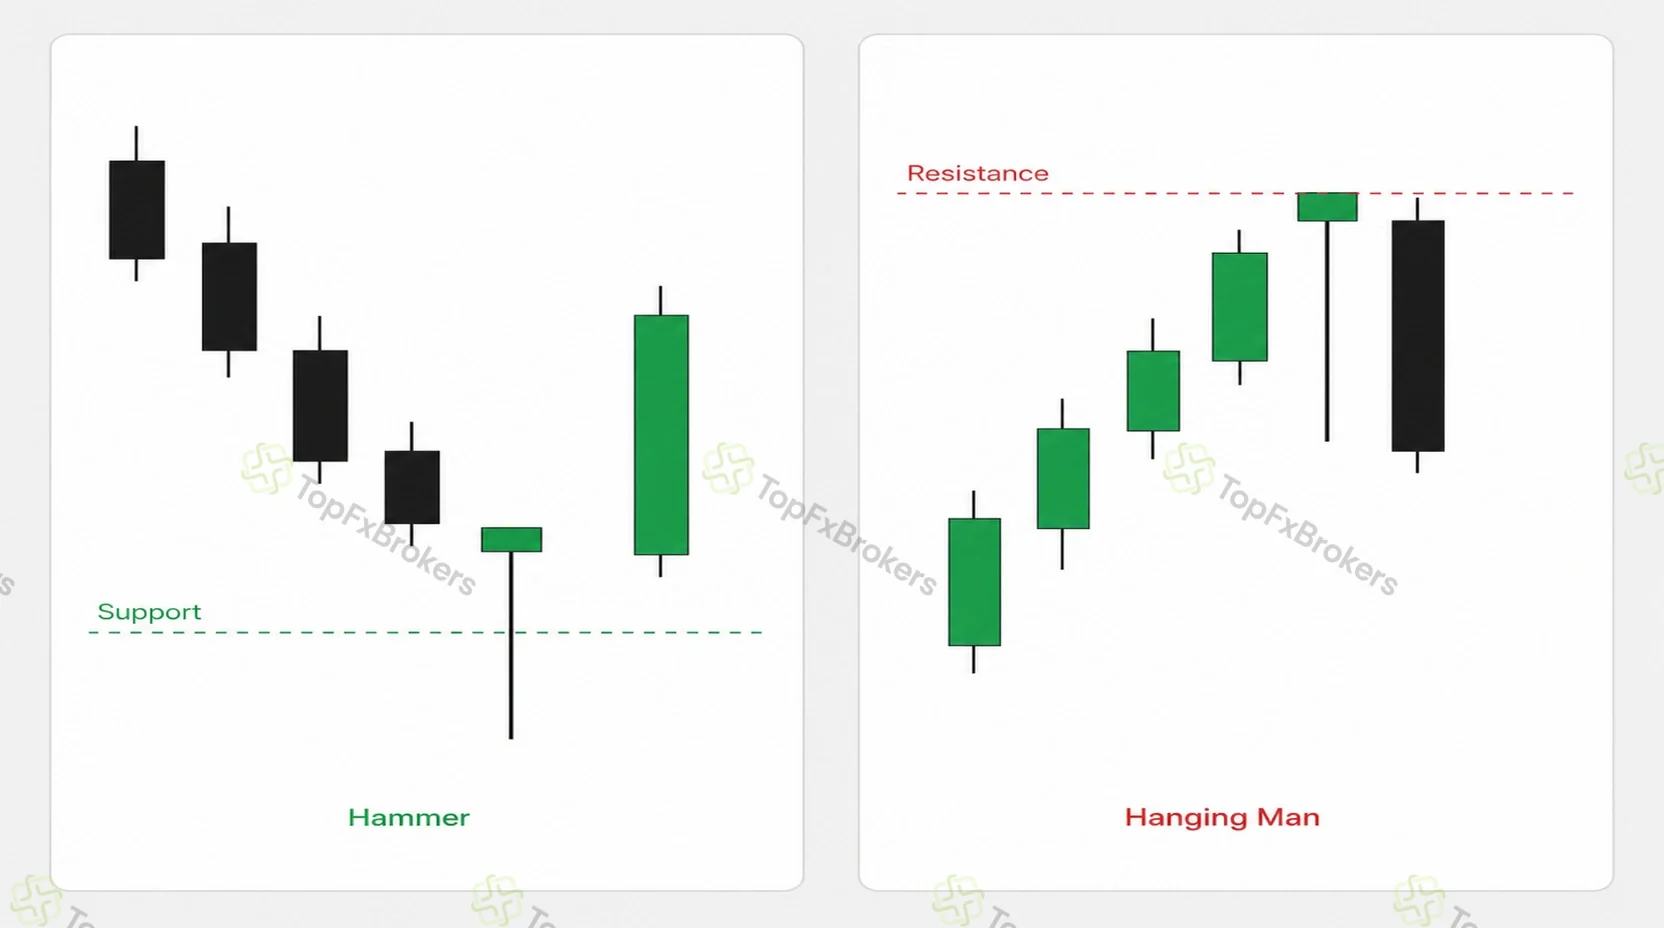
A hammer and hanging man have similar shapes: a relatively small body near the top of the candle and a longer lower wick. Their interpretation depends mainly on context.
A hammer commonly appears after a decline or pullback and may show that sellers could not maintain lower prices. A hanging man appears after an advance and may warn that selling pressure has started to appear. Both normally need confirmation from the surrounding structure and following candle.
Bullish and Bearish Engulfing Candles
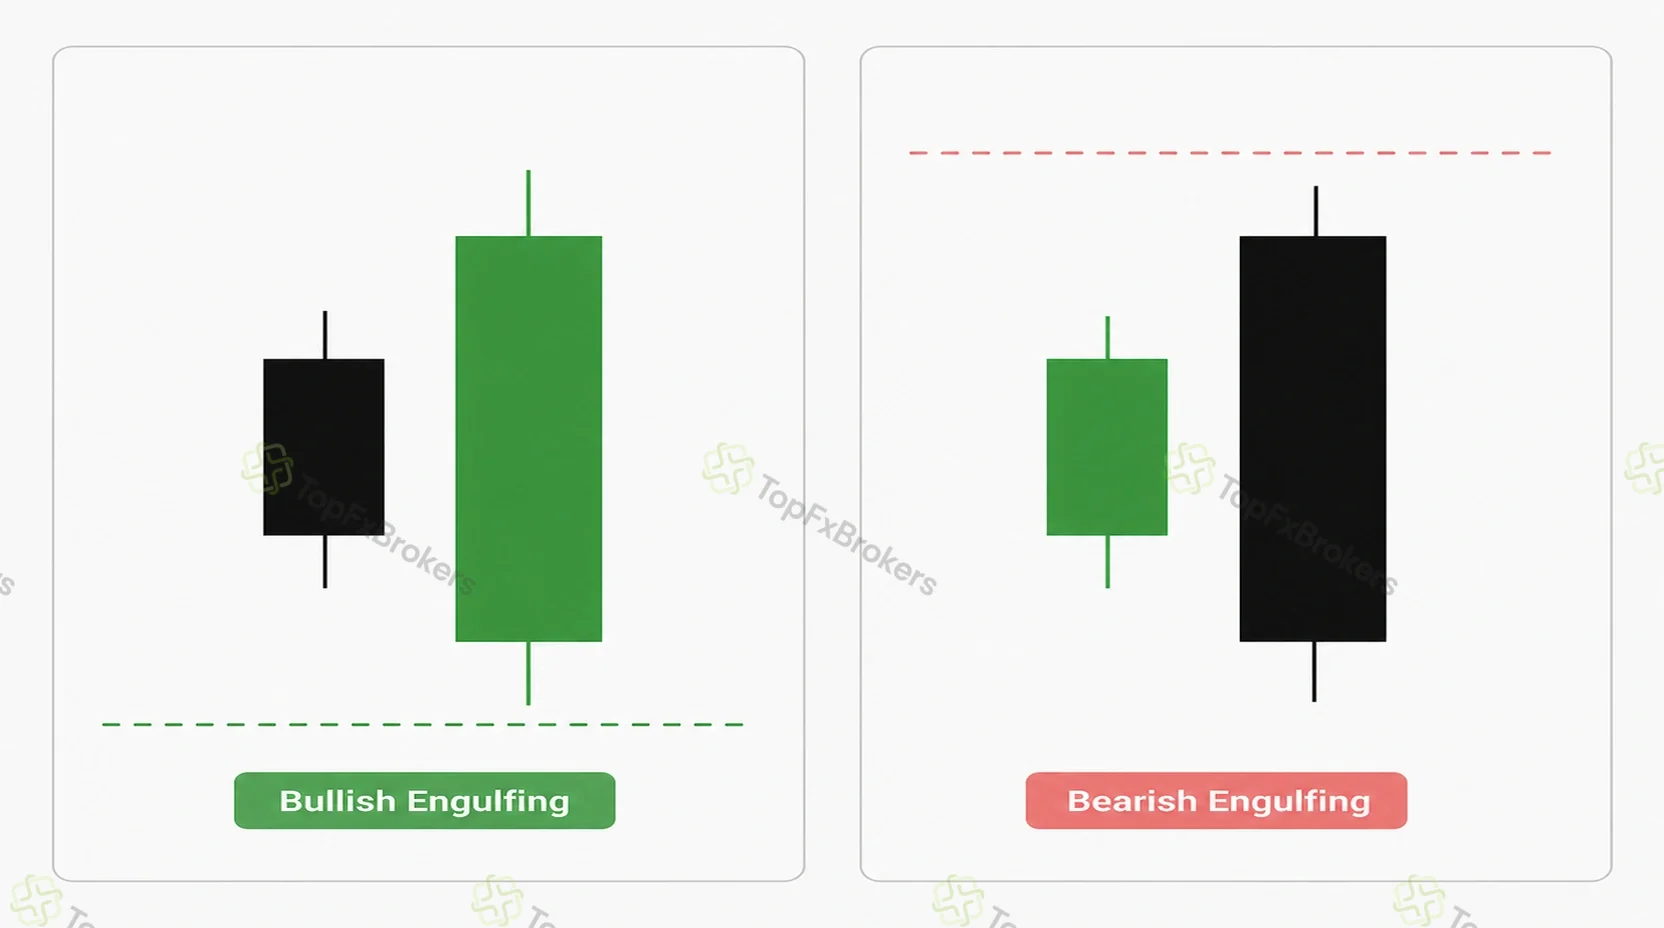
An engulfing pattern forms when the real body of the second candle overtakes the body of the preceding candle.
A bullish engulfing candle may show strengthening buying pressure, while a bearish version may indicate that sellers have gained short-term control. The pattern is more useful at support, resistance, after a pullback or around a failed move. Traders should wait for the engulfing candle to close and check whether enough space remains before the next opposing area.
Doji and Inside Bar
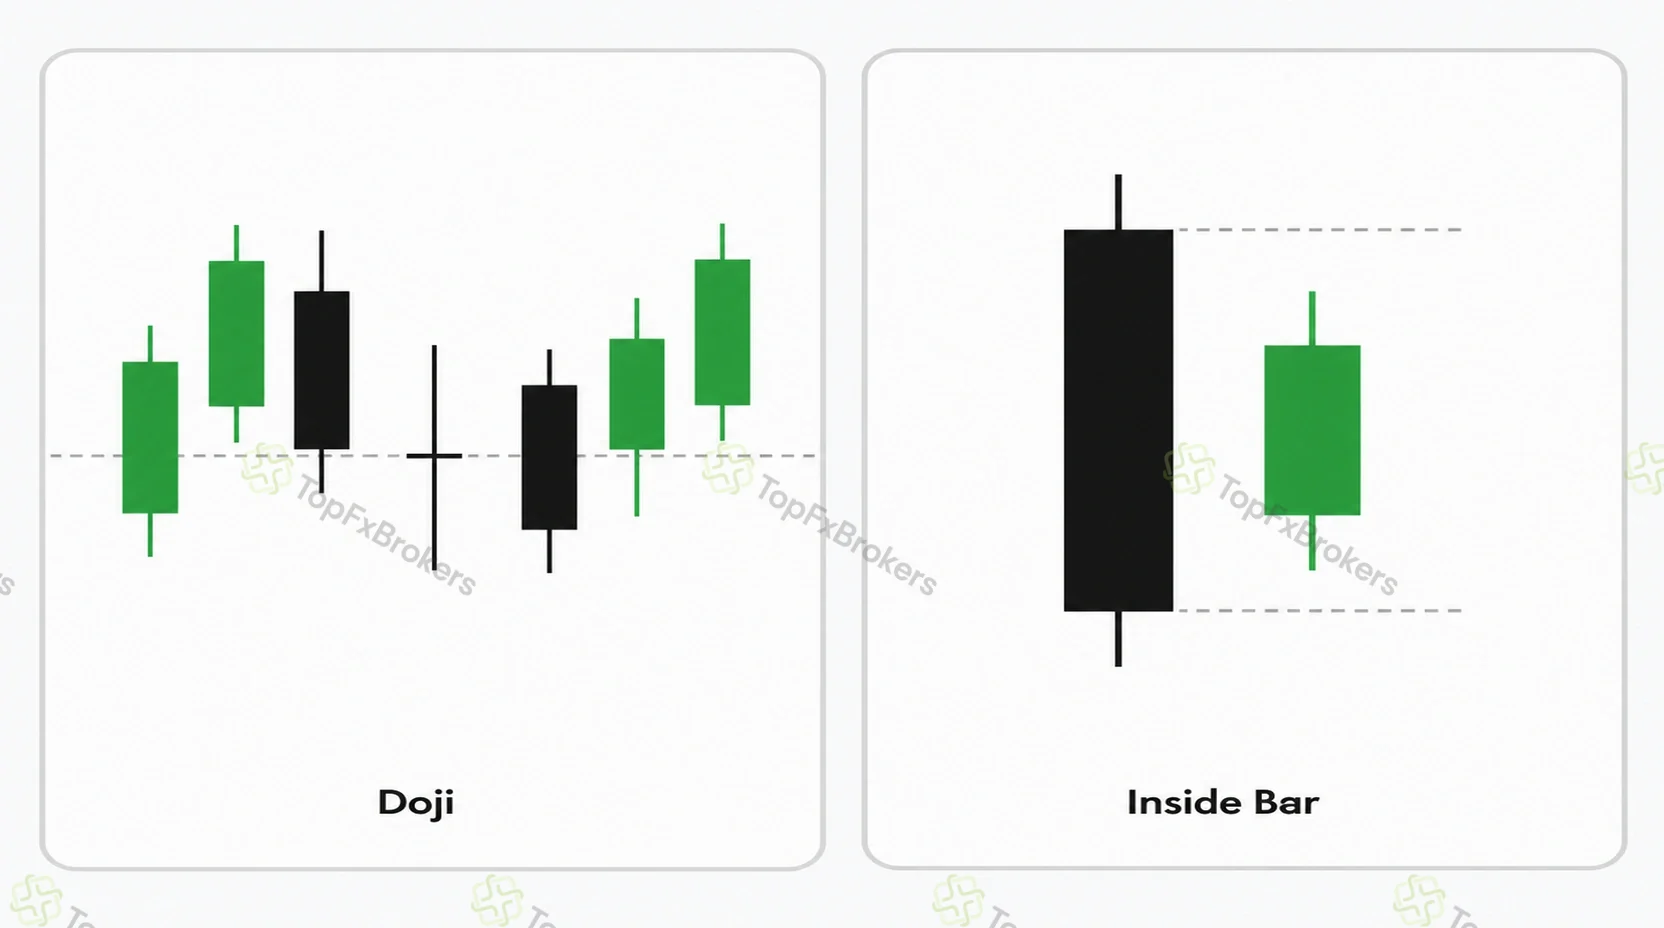
A doji forms when the open and close are very close, showing temporary balance or indecision. It does not reveal which side will win next, so the following reaction usually matters more than the doji itself.
An inside bar forms when its full range remains within the previous candle’s high and low. It shows short-term compression. Entry normally depends on how price leaves the combined range rather than on the inside bar’s appearance alone.
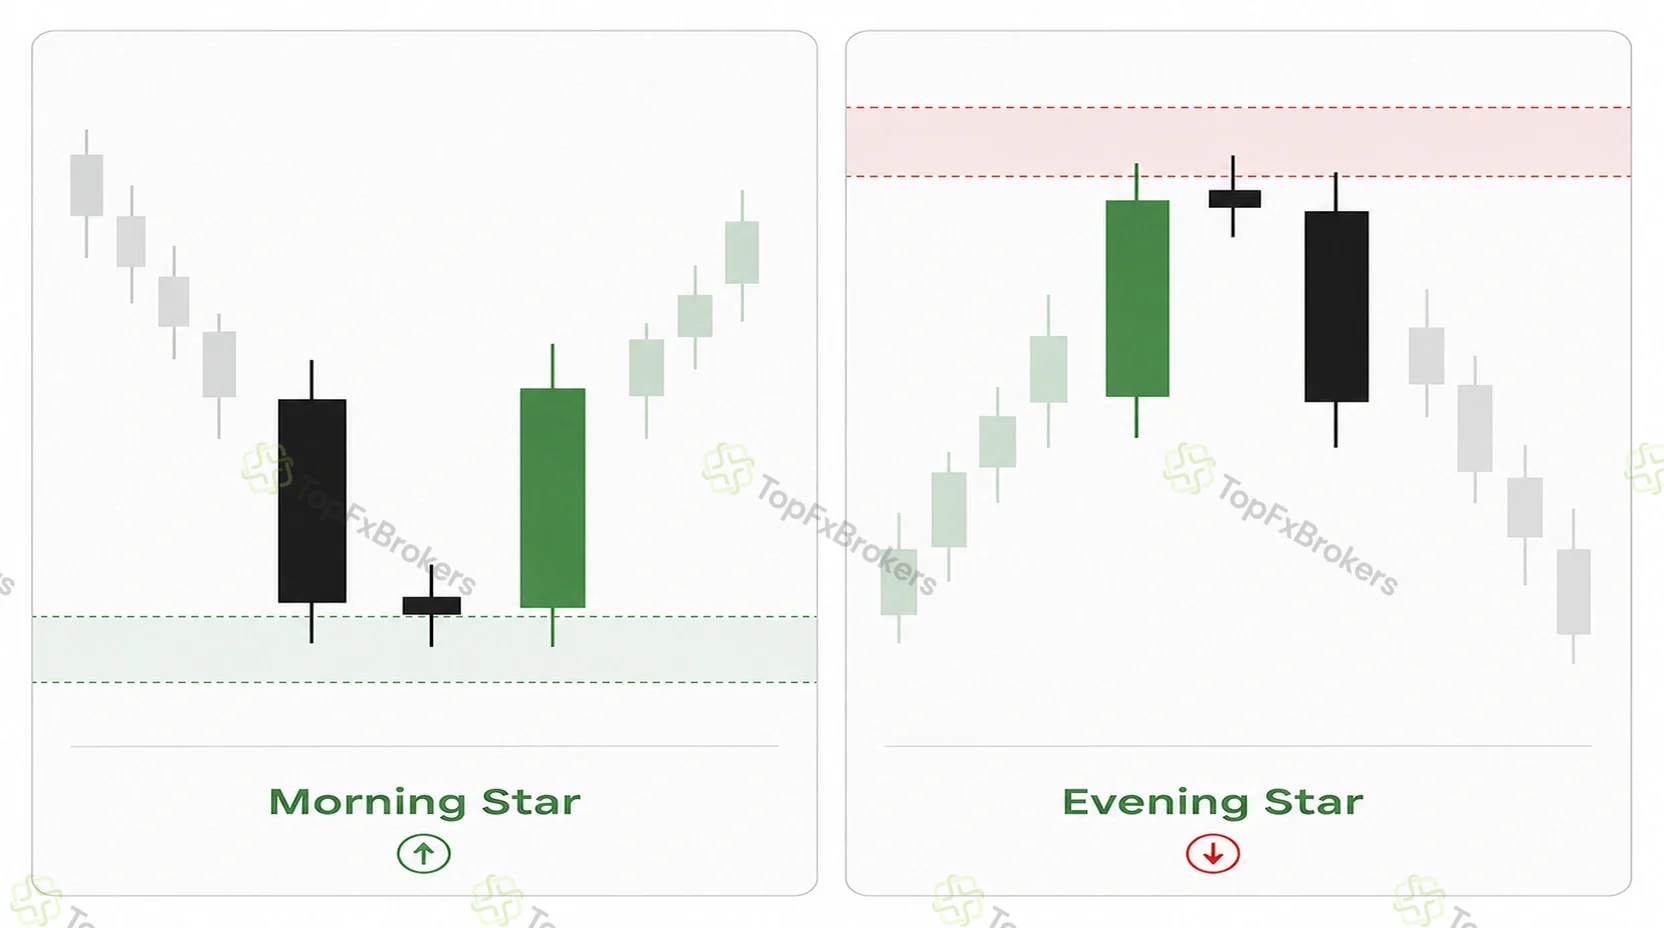
Morning Star and Evening Star
A morning star is a three-candle bullish reversal formation. It begins with bearish movement, continues with a smaller candle showing reduced momentum and ends with a stronger bullish candle.
An evening star is the bearish counterpart. It begins with bullish momentum, moves into hesitation and ends with a stronger bearish candle. Both patterns become more meaningful near established support or resistance after a developed move.
Strong Continuation Candles
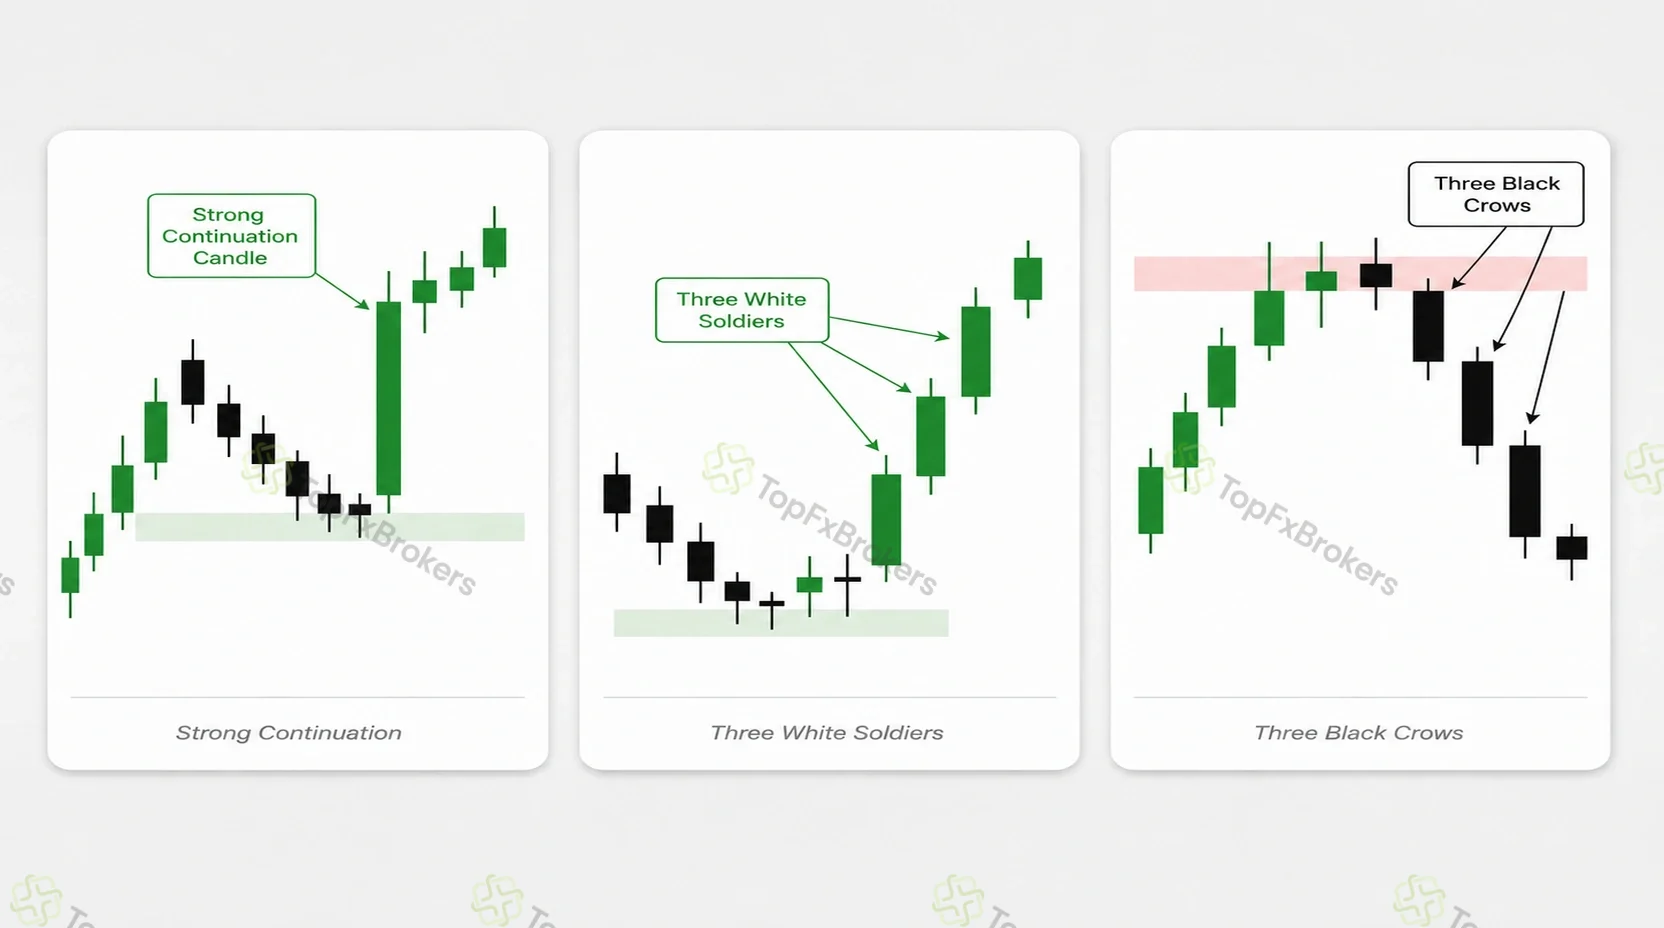
A strong continuation candle has a relatively wide body and closes near the end of its range in the direction of the broader move.
It can confirm that price is leaving a pullback, breaking a boundary or responding decisively to a zone. Its usefulness depends on whether the candle appears early enough to leave a practical entry. Entering after an abnormally large candle may produce a wide stop or place the position too close to the next obstacle.
Three White Soldiers and Three Black Crows
Three white soldiers consist of three consecutive bullish candles that close progressively higher. Three black crows consist of three bearish candles that close progressively lower.
The formations may show sustained directional pressure after a structural change or rejection. However, an entry after the third candle can be late if price is already extended or approaching an opposing zone. The sequence should therefore be assessed through location rather than treated as an automatic signal.
Five Practical Price Action Trading Strategies
The strategies below combine broader chart structure with shorter-term candle confirmation. Each one follows the same sequence: context, location, structure, trigger, entry, invalidation and target.
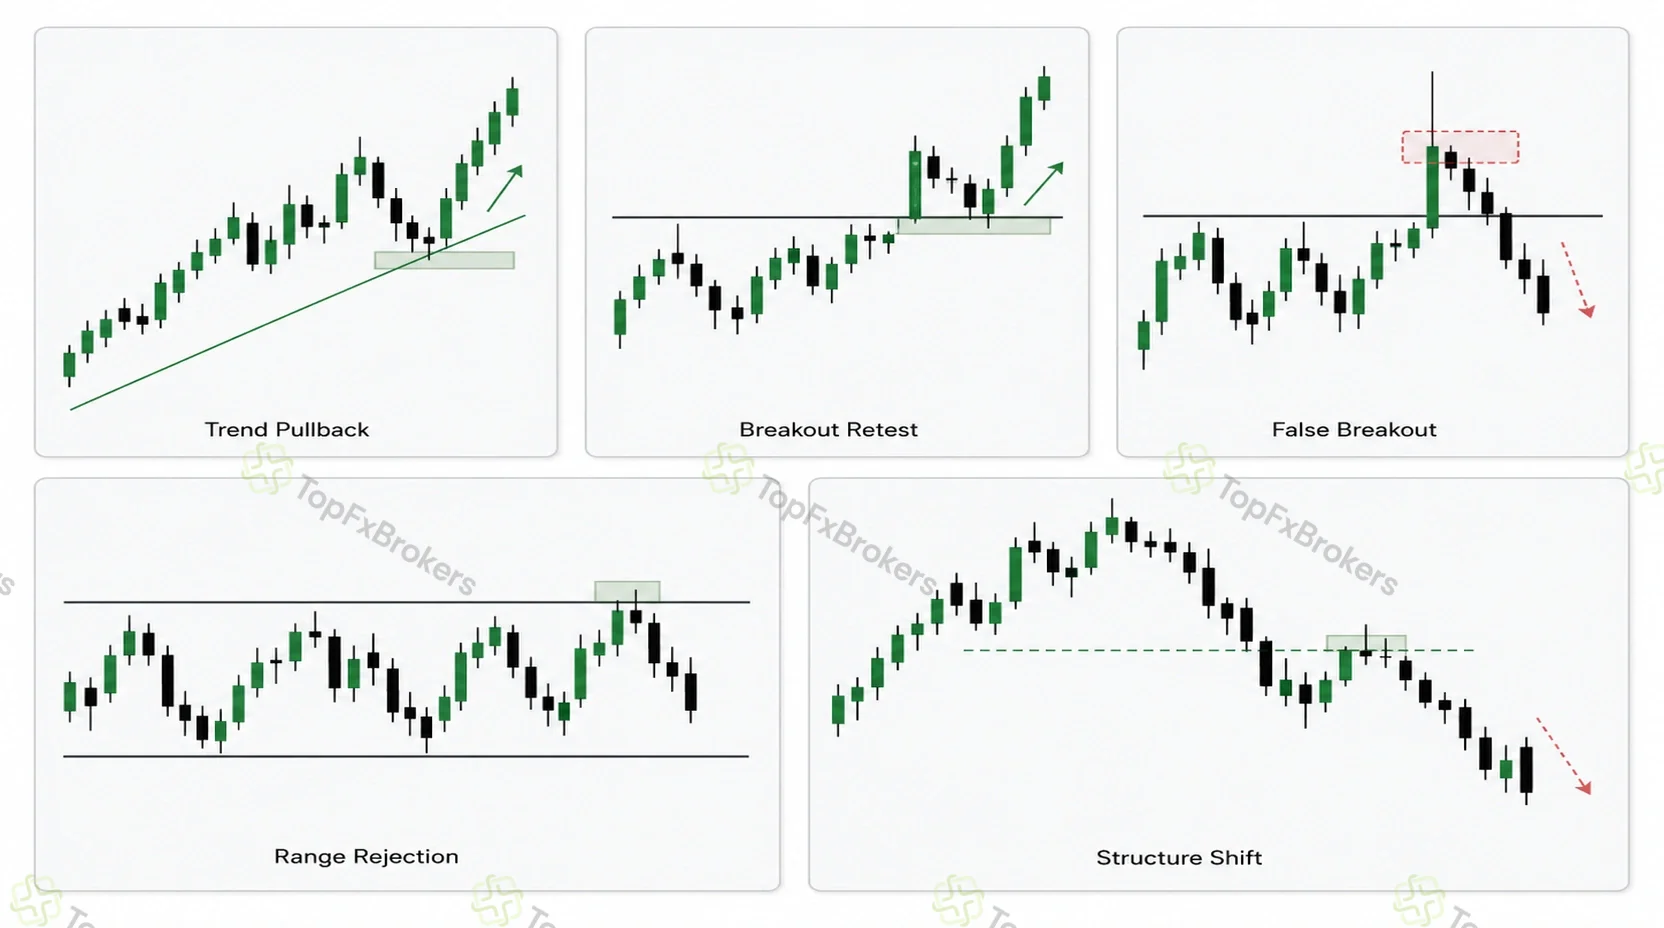
This does not make the setups certain. It makes the reasoning clear enough to review and test.
Trend Pullback and Continuation
A trend pullback strategy looks for temporary movement against an established trend, followed by evidence that the prevailing direction is resuming.
The chart should show a recognizable trend, and the pullback should approach an area with structural relevance, such as former resistance acting as support, former support acting as resistance or a major swing area. The trigger may be a rejection candle, engulfing close, break of minor corrective structure or strong continuation candle.
The stop normally belongs beyond the point that makes continuation unreasonable. The first target may be the previous trend high or low, followed by a wider structural target if the move extends.
Example: Price is making higher highs and higher lows. It pulls back to former resistance that has become support and forms a bullish engulfing candle. An entry above the engulfing candle may be considered, with invalidation below the pullback low and an initial target near the previous high.
The setup should usually be avoided when the trend is already extended, the pullback breaks a major structural point or the entry appears directly beneath important resistance.
Breakout and Retest
A breakout and retest strategy looks for price to move beyond an established boundary and confirm that the broken area is holding in its new role.
The boundary should be clearly visible and should have influenced price before the break. A stronger breakout normally contains a decisive close beyond the level and continued trading outside the previous structure. During the retest, price should reject the level rather than closing deeply back inside the old range.
Entry may follow a rejection candle or a break of the retest candle. The stop can sit beyond the retest swing or inside the former structure at the point where the breakout idea becomes doubtful. The next major support or resistance area can provide a target.
Not every breakout retests. Waiting for the return improves selectivity but also means that some valid moves will be missed.
False Breakout and Rejection
A false breakout strategy looks for price to move beyond an important level, fail to remain there and return through the boundary.
The setup is common near range edges and previous swing highs or lows. A close back inside the earlier structure, an engulfing candle or a strong rejection can provide confirmation. An aggressive entry may follow the close through the level, while a more conservative entry waits for a small retest of the failed-break area.
The stop normally belongs beyond the false-break extreme. The first target may be an internal range level, while the opposite boundary can be considered when the range remains intact.
Example: Price briefly breaks above a range that has capped three previous advances. The breakout candle cannot hold, and the next candle closes back below resistance. A later retest of the failed-break area produces a bearish rejection. The setup is based on rejection of prices above the range, with invalidation beyond the false-break high.
The main danger is entering too early. A temporary pause beyond a level can still develop into a valid breakout.
Range-Boundary Rejection
A range-rejection strategy looks for evidence that price is being rejected from the upper or lower boundary of an established sideways structure.
The range should have recognizable boundaries. Entries are considered near those areas rather than in the middle. At support, traders may look for a bullish rejection, failed break or engulfing candle. At resistance, they may look for the bearish equivalent.
The stop generally belongs outside the boundary and beyond the rejection extreme. A conservative target may be an internal reaction area, while a wider target may be near the opposite side of the range.
The strategy becomes invalid when price closes convincingly beyond the boundary and begins accepting prices outside the range.
Reversal After a Structural Shift
A reversal strategy should require more than one candle moving against the previous trend.
A higher-quality reversal normally develops through a sequence. The trend loses momentum, price fails to continue, an important structural level breaks and the market confirms the change. In an uptrend, price may fail to create a meaningful new high and then break below an important higher low. In a downtrend, the opposite process may occur.
A retest of the broken structural level, followed by rejection in the new direction, can provide an entry. The stop belongs beyond the retest swing or the level whose recovery would restore the earlier structure. A previous swing or opposing support or resistance zone may provide the target.
The setup should be avoided when only a minor swing has broken while the broader trend remains intact.
Examples of a Valid Setup That Still Failed
A reasonable setup can meet its rules and still produce a loss. Suppose price reaches established resistance in a range and forms a bearish rejection candle. The candle closes, the short entry is triggered below its low, the stop is placed beyond the rejection high and the target is set toward the range midpoint. Instead of following through, price holds near resistance, forms several small candles and then closes decisively above the zone, reaching the stop.
The failure does not necessarily mean the original analysis was careless. It shows that confirmation changes the quality of a decision, not the certainty of the outcome. The important questions are whether the setup followed the written plan, whether the invalidation level was logical and whether the position size kept the loss within the intended limit. A losing example is therefore as useful for review as a successful one.
Using Multiple Timeframes
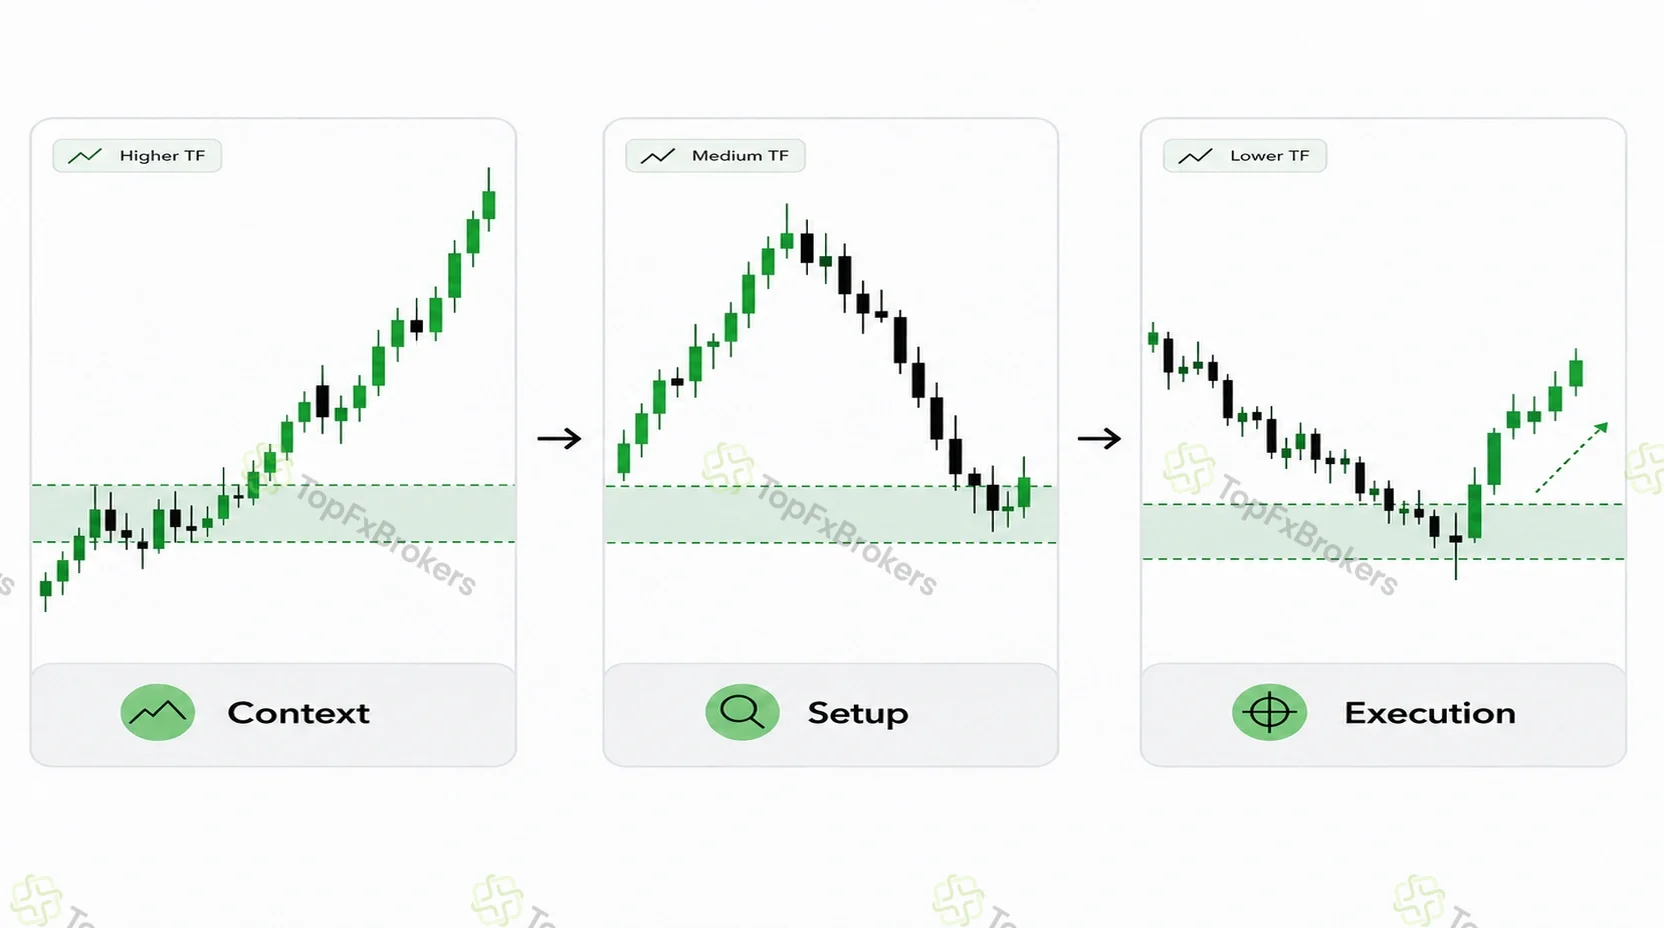
Multiple-timeframe analysis connects broader context with a more precise setup.
The context timeframe shows the larger trend, range and major support or resistance. The setup timeframe shows how price behaves as it reaches the area. An execution timeframe may provide a more precise trigger when the setup chart does not offer enough detail.
Not every trade needs all three. Adding more timeframes can create conflicting interpretations and encourage traders to keep searching until one chart supports the desired position.
A useful approach is to choose the context and setup timeframes before analyzing the trade. The execution timeframe should only be added when it serves a defined purpose. The broader chart should not be used to excuse a weak lower-timeframe setup.
Shorter timeframes usually produce more signals, but they also make spread, slippage and small changes in liquidity more influential. Intraday charts are shaped by trading sessions and scheduled announcements. Higher timeframes normally produce fewer setups and filter some short-term noise, although they may require wider structural stops and expose the position to overnight or multi-session events.
Timeframe alignment does not mean that every chart must point in exactly the same direction. A bearish correction on the setup timeframe can form inside a broader bullish trend. The aim is to understand the role of each view before entry rather than switching timeframes until one supports the desired conclusion.
Markets and Trading Styles
Price action principles can be applied across currencies, indices, shares, commodities and digital assets, but the same formation may behave differently because trading hours, liquidity, volatility and available data vary.
How Price Action Varies Across Markets
Currency markets trade across overlapping global sessions, so the quality of a short-term pattern may depend on whether major financial centers are active. Because the market is decentralized, displayed volume and order-flow data may be provider-specific. Indices can react strongly around the opening and closing of their underlying markets, major economic releases and changes in constituent shares.
Individual shares may gap after earnings, company announcements or market closures, and less-liquid shares can produce wider spreads and less orderly candles. Commodities may respond to inventories, seasonality, supply disruptions and geopolitical events. Digital assets trade continuously, but liquidity and price can vary between venues. These differences do not change the basic framework; they change how zones, stops, execution and event risk should be evaluated.
Scalping, Day Trading, Swing Trading and Position Trading
Scalping applies price action to very short holding periods. It demands precise execution because small spreads and slippage can represent a large part of the expected move. Day trading focuses on positions opened and closed within a session, making session liquidity, news timing and intraday range especially important.
Swing trading holds positions across several sessions and gives broader chart structures more time to develop, but it also introduces overnight gaps, financing considerations and wider stops. Position trading relies on higher-timeframe structure and may hold through larger corrections, requiring patience and tolerance for extended exposure.
No trading style is automatically best for price action. The suitable approach depends on available time, execution costs, risk tolerance, market behavior and whether the rules have been tested over a representative sample. The timeframe and holding period should be selected before a setup is judged.
Entries, Stops and Profit Targets
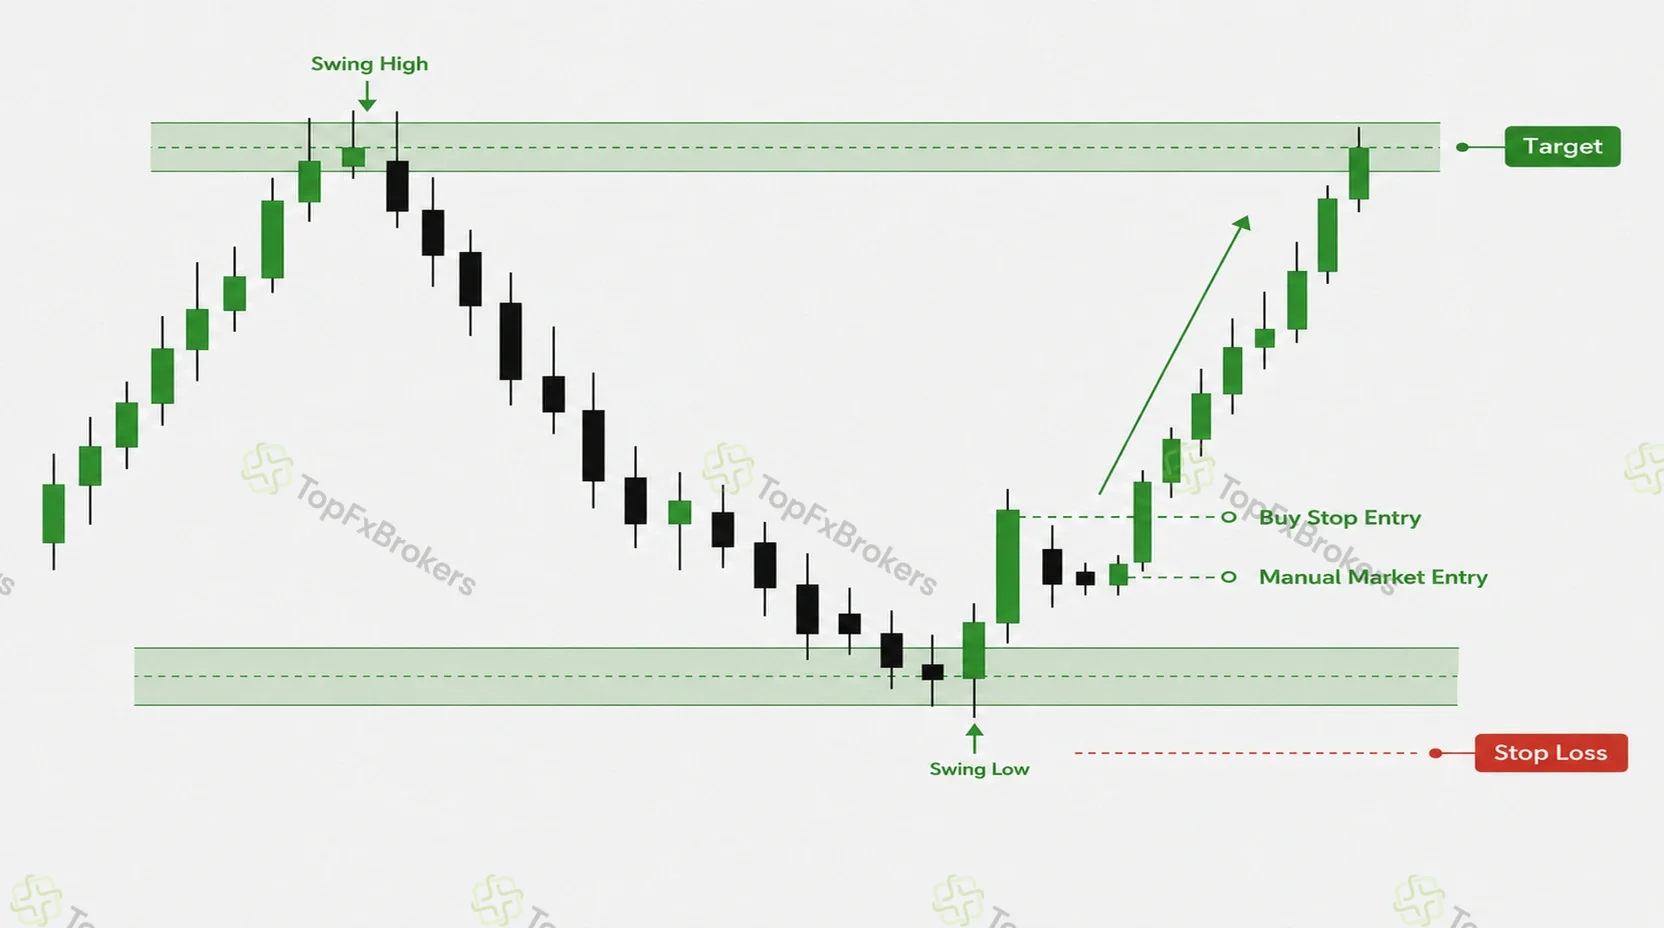
A price action setup can offer several entry methods. A trader may enter after the confirming candle closes, use a stop-entry order beyond the candle or wait for a retracement into the signal area.
Waiting for the close reduces the risk of acting on a formation that disappears before completion. A stop-entry requires continued movement in the intended direction, but a fast move may cause slippage. A retracement can improve the entry price, although it may never occur or may continue through the zone.
The stop should mark the point where the original idea is no longer valid or has become materially weaker. For a trend pullback, it may sit beyond the swing protecting the trend. For a breakout retest, it may sit back inside the previous structure. For a false break, it may sit beyond the failed-break extreme.
A target should be based on a realistic area where price may meet opposing interest. Possible references include a previous swing, the opposite side of a range, the next support or resistance zone, a measured projection or a predefined multiple of the initial risk.
A fixed risk multiple can support consistency, but it should not override market structure. If the technically sensible target offers too little potential reward compared with the stop, the setup can be declined rather than forced.
Execution, Risk Management and Trading Psychology
Historical charts can make entries and exits appear precise. Real execution introduces spreads, bid and ask prices, liquidity, order type and slippage. A market order prioritizes execution but not the exact price. A limit order prioritizes price but may not be filled. A stop order can be triggered during a fast move and filled beyond its requested level.
Scheduled announcements, unexpected news and changes between active sessions may also alter candle behavior. Holding a position beyond the intended period can introduce gap risk, financing costs or exposure to events that were not part of the original setup.
Risk management determines how much damage a failed idea can cause. Once the entry and technical stop have been identified, position size can be adjusted so that the monetary loss at the stop remains within the chosen limit.
For example, an account value of 10,000 with a selected risk of 0.5% gives a maximum planned loss of 50 before accounting for slippage and costs. The stop distance then determines the appropriate position size. The percentage is an illustration, not a recommendation suitable for every trader.
Risk should also be considered across the full portfolio. Several positions in closely related markets may behave like one large position even when each trade appears modest.
Trading psychology is closely connected to these rules. Fear can cause premature exits, while overconfidence can encourage oversized positions or repeated entries after losses. A written process, predefined limits and consistent review reduce the number of decisions made under pressure. Process discipline also means accepting missed trades, normal losses and periods with no valid setup rather than changing rules simply to remain active.
When Price Action Should Not Be Traded
A setup may be visually attractive and still be unsuitable. Common reasons to avoid a trade include:
- Price is in the center of a range with no clear directional advantage.
- The entry is directly beneath resistance or above support.
- The wider structure and candle signal contradict each other.
- Price has already travelled most of the expected distance before confirmation appears.
- The stop must be so wide that the remaining reward is inadequate.
- The pattern is visible only after excessive chart adjustment or selective line drawing.
- Market movement is unusually erratic because of news, gaps or poor liquidity.
- Several open positions create more combined exposure than the plan permits.
A useful classification is to treat conditions as tradable, questionable or no-trade.
A tradable setup has clear context, location, confirmation and controlled risk. A questionable setup contains useful evidence but also an unresolved weakness, such as a nearby obstacle. A no-trade condition has no clear invalidation, insufficient space or market behavior that cannot be organized into a coherent plan.
Avoiding a questionable setup does not require proving that it will fail. The absence of a sufficiently clear opportunity is enough.
How to Test a Price Action Strategy
Price action contains discretion, but that does not make testing impossible.
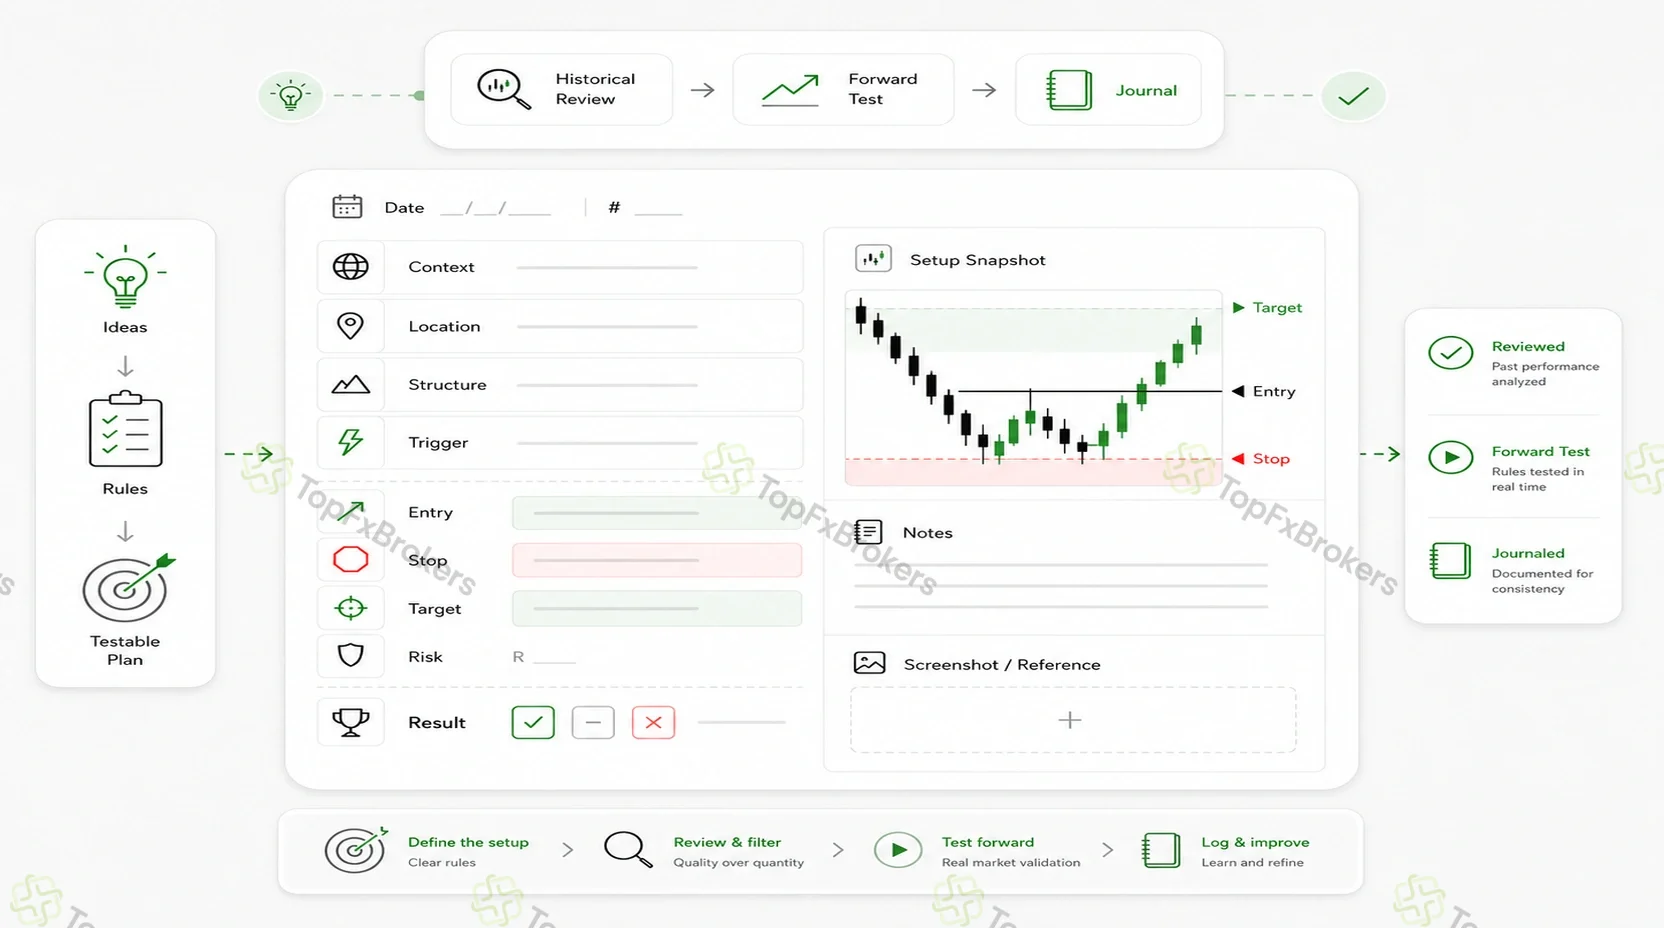
The first step is to convert broad ideas into written conditions. “Buy bullish price action at support” is too vague to review consistently. A more testable rule should define the timeframe, market condition, method used to identify support, acceptable trigger candles, entry method, stop placement, target method and conditions that cancel the setup.
Historical review can then examine how the rules would have behaved across different environments. Screenshots should be recorded without using future price movement to improve the original interpretation.
Forward testing adds another layer because the decision is documented before the outcome is known. This helps reveal hesitation, missed trades, execution differences and rules that appeared clear only in hindsight.
A useful journal records the market condition, location, structure, trigger, entry, stop, target, position risk, result and whether the strategy rules were followed. Results should also be separated by setup and environment because a method may perform differently in trends, ranges and quiet or volatile periods.
The purpose of testing is not to prove that a strategy always works. It is to understand where it has historically been useful, how often it fails, what its drawdowns look like and whether its rules can be applied consistently.
Advantage and Limitations of Price Action Trading
Price action keeps attention on the underlying market rather than several transformed versions of the same data. It can be used in trends, ranges, breakouts and reversals, and the same structural logic can help define entries, invalidation points and targets. A relatively clean chart may also make it easier to explain why a trade exists and to review whether the original reasoning remained valid.
Its flexibility is also a limitation. Two traders may select different swings, draw zones at different widths or interpret the same consolidation differently. Patterns can fail, and charts often look clearer after the outcome is known than they did in real time. Market conditions can change faster than a visual model adapts, while spreads, gaps and slippage may cause live results to differ from ideal historical examples.
Price action therefore becomes more useful when discretion is constrained by written definitions. The trader should know which market conditions are acceptable, how a zone is identified, what confirms entry and where the trade becomes invalid. Price action reduces neither uncertainty nor the need for risk control; it provides a framework for making those uncertainties more explicit.
Price Action Trading Checklist
Before opening a position, work through the following process:
- Define whether the market is trending, ranging, compressing or unclear.
- Mark the support, resistance or structural area relevant to the setup.
- Identify the major swings and determine whether the structure remains intact.
- Write the expected scenario and what would disprove it.
- Wait for the required candle or structural trigger.
- Set the stop where the trade idea becomes invalid.
- Confirm that the target is realistic and that enough space exists before the next obstacle.
- Calculate position size using the stop distance and selected account risk.
- Check spreads, liquidity, correlated exposure and scheduled event risk.
- Record the setup and later review whether the written rules were followed.
The checklist is designed to slow the decision process down. A setup that cannot be explained clearly before entry is unlikely to become clearer once money is at risk.
Conclusion
Price action trading is not simply the act of finding familiar candles on a chart. It is a structured way of interpreting market behavior.
The process begins with context. The trader identifies whether the market is trending, ranging, compressing or behaving unpredictably. Location then determines where price deserves attention. Chart structure reveals whether buyers or sellers remain in control, while candle price action shows whether the planned setup is receiving short-term confirmation.
Risk completes the process.
A trade is not fully defined until the entry, invalidation level, target, position size and execution conditions are understood. Even a well-structured setup can fail, which is why testing, record keeping and controlled exposure remain essential.
The strongest price action decisions usually come from alignment: the market condition is clear, price is at a meaningful location, structure supports the scenario, a valid trigger appears and the potential loss is controlled.
When those elements do not align, waiting is not a missed opportunity. It is part of the strategy.
FAQ
Is Price Action the Same as Technical Analysis?
Price action is a form of technical analysis. It focuses primarily on price movement, market structure and reactions around important areas. Other approaches may rely more heavily on calculated indicators, statistical tools or systematic conditions.
Can Price Action Be Used Without Indicators?
Yes. A strategy can be based entirely on price, structure and key levels. However, there is no requirement to avoid every indicator. A supporting tool may be useful when it has a defined purpose and does not replace the reading of price.
Which Timeframe Is Best for Price Action Trading?
There is no single best timeframe. The appropriate choice depends on the intended holding period, market activity, volatility, execution costs and how frequently the trader can monitor the position. Very short timeframes normally contain more noise, while higher timeframes may require wider stops and longer holding periods.
What Is the Difference Between Chart and Candle Price Action?
Chart price action examines broader structures created across multiple candles, such as trends, ranges, breakouts and reversal formations. Candle price action focuses on individual candles or short sequences that may refine timing and confirmation. The chart normally provides context first; the candle provides shorter-term evidence second.
What Is the Most Important Price Action Pattern?
No single pattern is consistently the most important. Location and structure normally matter more than the pattern name. A simple rejection at an established level may be more useful than a complex formation in an unclear area.
How Can False Breakouts Be Filtered?
A trader can examine whether the breakout closed meaningfully beyond the level, whether price followed through, whether the move entered open space and whether a later retest held. No filter removes every failed breakout.
Where Should a Stop Loss Be Placed?
The stop should generally sit beyond the point that invalidates the trade idea. For a rejection setup, this may be beyond the rejection extreme. For a trend pullback, it may be beyond the swing protecting the trend. The stop distance should determine position size rather than the position size forcing an unsuitable stop.
Does Price Action Work in Both Trends and Ranges?
Price action can be used in both conditions, but the strategy must change. In a trend, traders may focus on pullbacks and continuation. In a range, attention shifts toward boundary rejection, false breaks and eventual breakout confirmation.
Can Price Action Be Backtested?
Yes, although discretionary ideas must first be converted into rules that can be applied consistently. Historical review, forward testing and detailed journaling can help determine whether a setup is repeatable or only appears convincing after the outcome is visible.
Why Do Traders Interpret the Same Chart Differently?
Traders may use different timeframes, swing definitions, zone widths, holding periods and risk rules. A written framework reduces this subjectivity but cannot eliminate it completely.

Written by:
Daniel Harris
At TopFxBrokers, Daniel focuses on broker reviews, platform comparisons, educational guides, and market analysis. His writing emphasizes transparency, accuracy, and balanced evaluations, enabling readers to make informed trading decisions. He regularly follows central bank policies, economic data releases, and industry developments to keep his research current and relevant.
Daniel's goal is to make financial markets more accessible to both new and experienced traders by presenting objective information in a straightforward, easy-to-understand format.