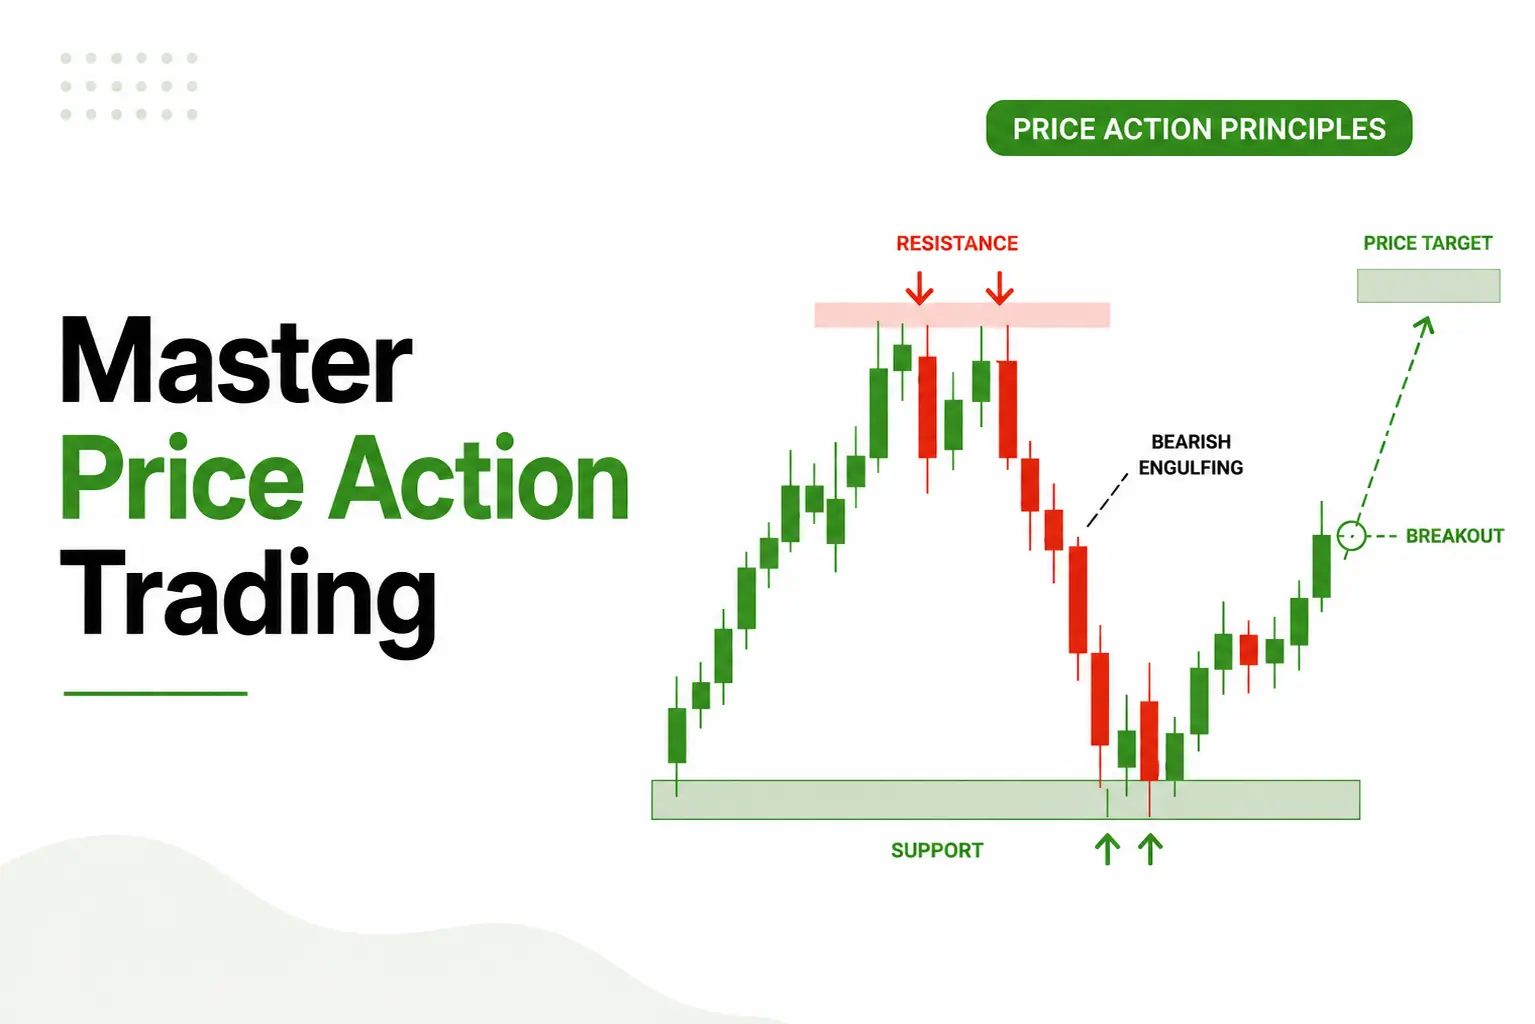

































Mean reversion is the idea that a currency pair that has moved unusually far from a relevant reference level may later return toward a more typical value. In forex trading, that reference might be a moving average, the midpoint of an established range, a session benchmark, or another estimate of short-term equilibrium.
The opportunity is not simply that price looks high, low, overbought, or oversold. A usable mean-reversion setup requires evidence that the deviation is temporary, the chosen reference still reflects the market's current balance, and the potential movement back toward that level justifies the risk required to trade it.
That distinction matters because exchange rates respond to interest-rate expectations, monetary policy, economic releases, political developments, liquidity, positioning, and new information. A sharp movement may be temporary, but it may also represent a lasting repricing. Mean reversion is therefore a conditional market behavior, not a rule that forces every currency pair back to an earlier average.
A disciplined process defines the reference before the signal, measures deviations consistently, waits for evidence that the extreme is being rejected, and establishes the entry, invalidation level, target, and maximum holding period before execution. The rules must then be evaluated across ranging and trending markets using realistic spreads, slippage, and financing costs.
Key Takeaways
- Mean reversion is most credible when price repeatedly rotates around a stable center and least credible when that center begins moving.
- A complete setup defines what is expected to revert, which level represents the mean, and how an unusual deviation will be identified.
- Bollinger Band touches, oversold RSI readings, and large Z-scores describe stretched conditions; none confirms a reversal by itself.
- Breakouts, expanding volatility, policy repricing, and persistent closes beyond an established structure can invalidate the original thesis.
- Every trade requires an objective trigger, structural invalidation point, target, position size, and maximum holding period before entry.
- Treat a strategy as credible only when its results remain reasonably stable across different periods, market regimes, and realistic cost assumptions.
What Is Mean Reversion in Forex Trading?
A forex mean-reversion strategy attempts to profit when an unusual deviation contracts. The position is taken against the recent movement only after price has traveled far enough from a relevant center and has started to show evidence of returning.
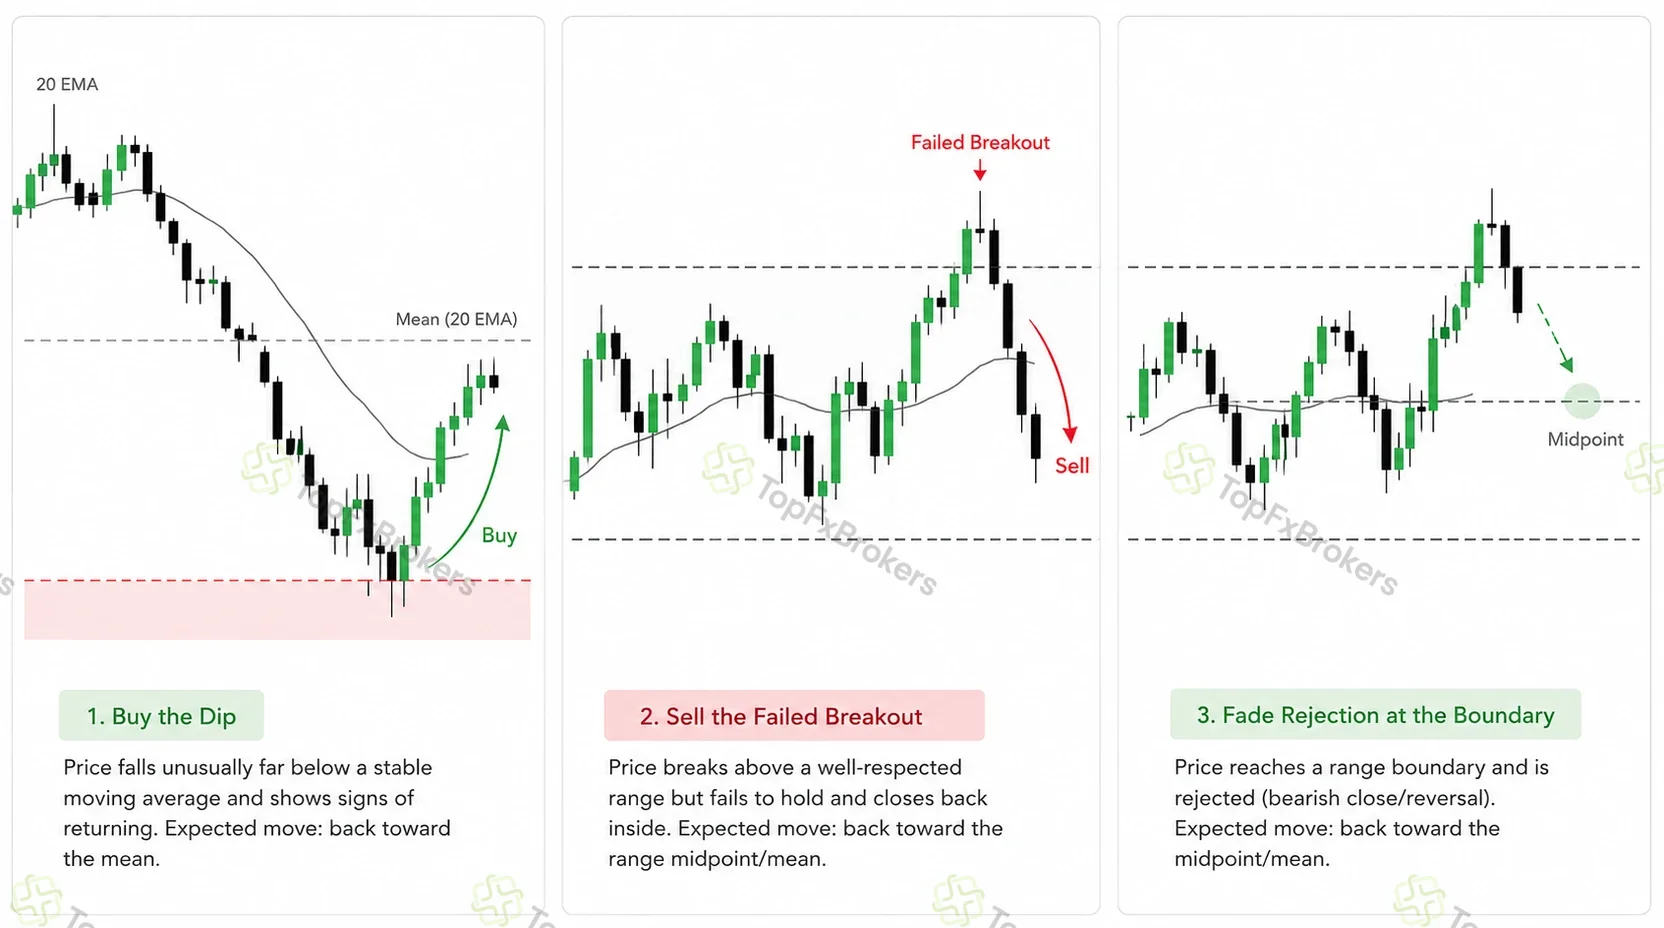
For example, a trader might buy EUR/USD after it falls unusually far below a stable moving average, sell after a failed breakout above a repeated range, or target the midpoint of an intraday consolidation after price rejects one of its boundaries. In each case, the expected profit comes from a return toward a previously established area of balance.
Temporary order imbalances, profit-taking, position adjustments, and reactions to short-lived information can create such deviations. Foreign-exchange order flow can also contain meaningful information, and its price impact differs according to the participants and circumstances involved. Some movements fade because the imbalance is temporary; others persist because the flow reflects information that changes the market's valuation.
What Can Revert in Forex?
The first task is to identify the variable the strategy expects to normalize.
For many discretionary traders, the variable is the outright price of a currency pair. A moving average, rolling median, range midpoint, or session reference serves as the mean. This approach is easy to understand, but an exchange rate can trend for an extended period. The selected level is an estimate based on recent observations, not a permanent fair value.
Some systems focus on an unusually large short-term movement rather than the entire price level. The expectation is that part of a one-candle or multi-candle move will be retraced. The target may therefore be a partial recovery rather than a complete return to a longer-term average.
A range-based strategy defines the mean structurally. When price repeatedly moves between support and resistance, the center of the range can provide the reference. An intraday method may instead use the session open, session midpoint, overnight range, or another benchmark calculated from the same data feed used for execution.
More advanced strategies trade a constructed relationship between currency instruments. Because correlation alone does not establish a stable spread, these methods require separate construction, stability, cost, and breakdown rules. This guide therefore concentrates on single-pair, price-based mean-reversion strategies.
A vague rule says that price is oversold. A testable rule identifies the currency pair, timeframe, reference mean, required deviation, confirmation trigger, invalidation point, target, and maximum holding period.
Price Returning to the Mean vs the Mean Catching Up
Price and a rolling average can meet in two different ways.
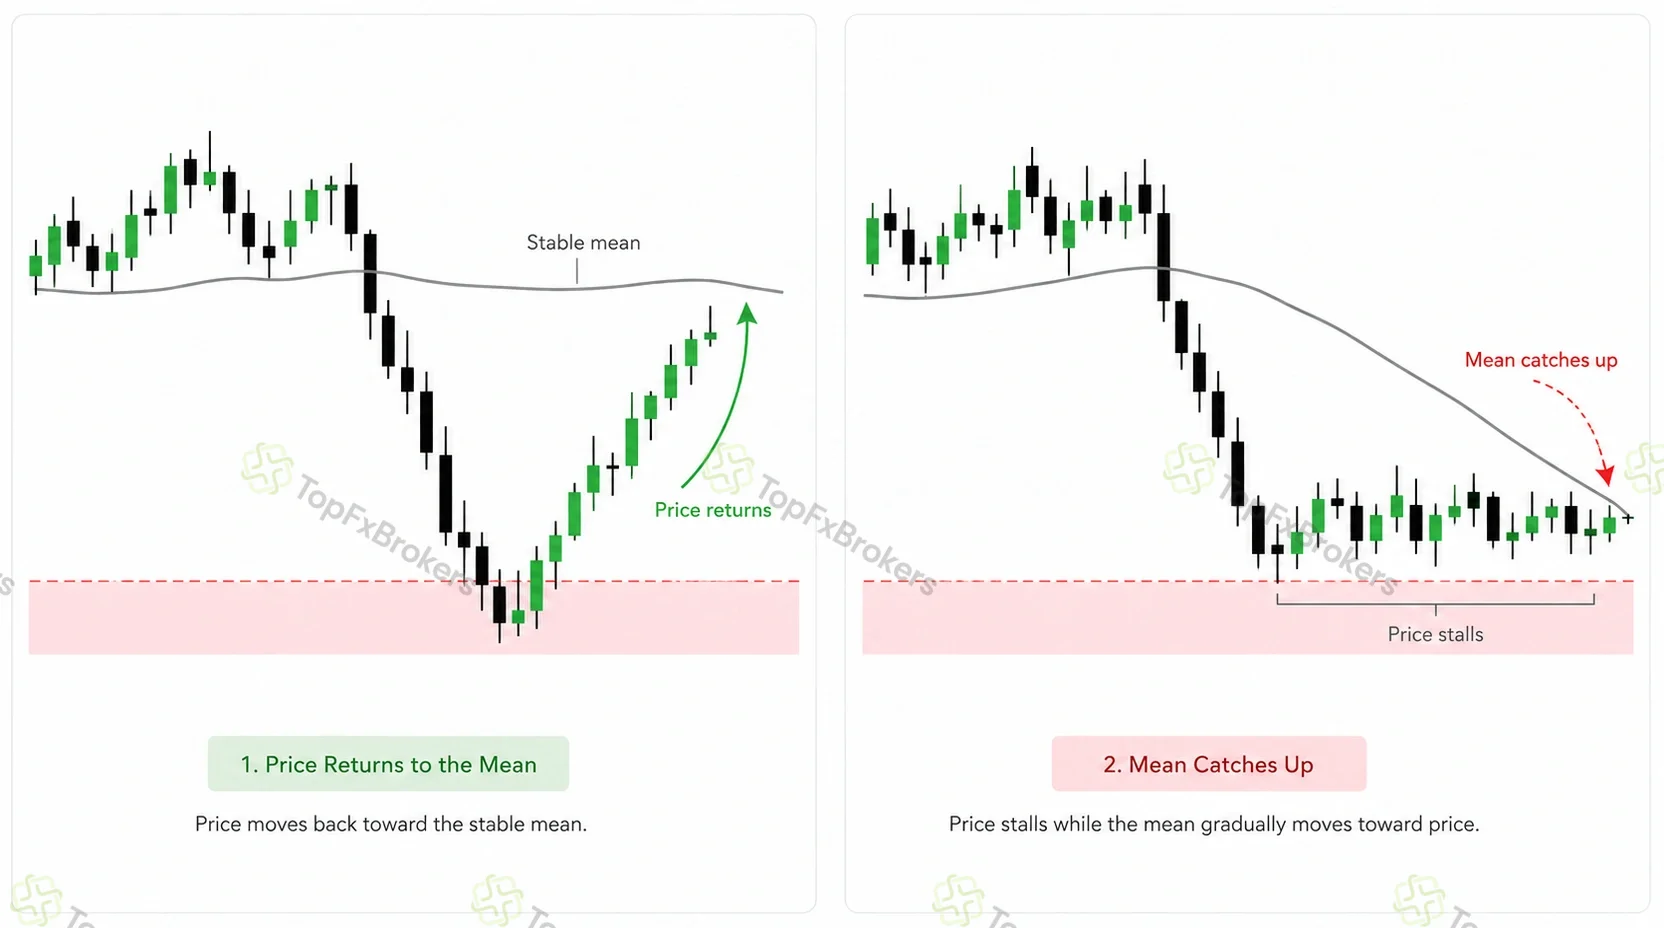
Price may reverse and move toward a stable mean. That is the result a conventional mean-reversion trade expects. Alternatively, price may stop moving while the rolling average gradually catches up as new observations enter the calculation and older ones leave it. The gap eventually closes on the chart, but the position may never receive the anticipated reversal.
This issue is especially important with fast moving averages. A responsive average adapts quickly after a large price movement, potentially reducing the available target before price travels meaningfully in the trade's direction. A slower average changes less, but it may remain anchored to market conditions that no longer describe the current environment.
The trade plan must therefore account for the mean's slope and speed. It should also state whether the target remains fixed at the level visible when the trade is opened or updates as each candle closes. When the mean begins accelerating away from the intended exit, the original target may no longer be realistic.
Mean Reversion vs an Ordinary Pullback
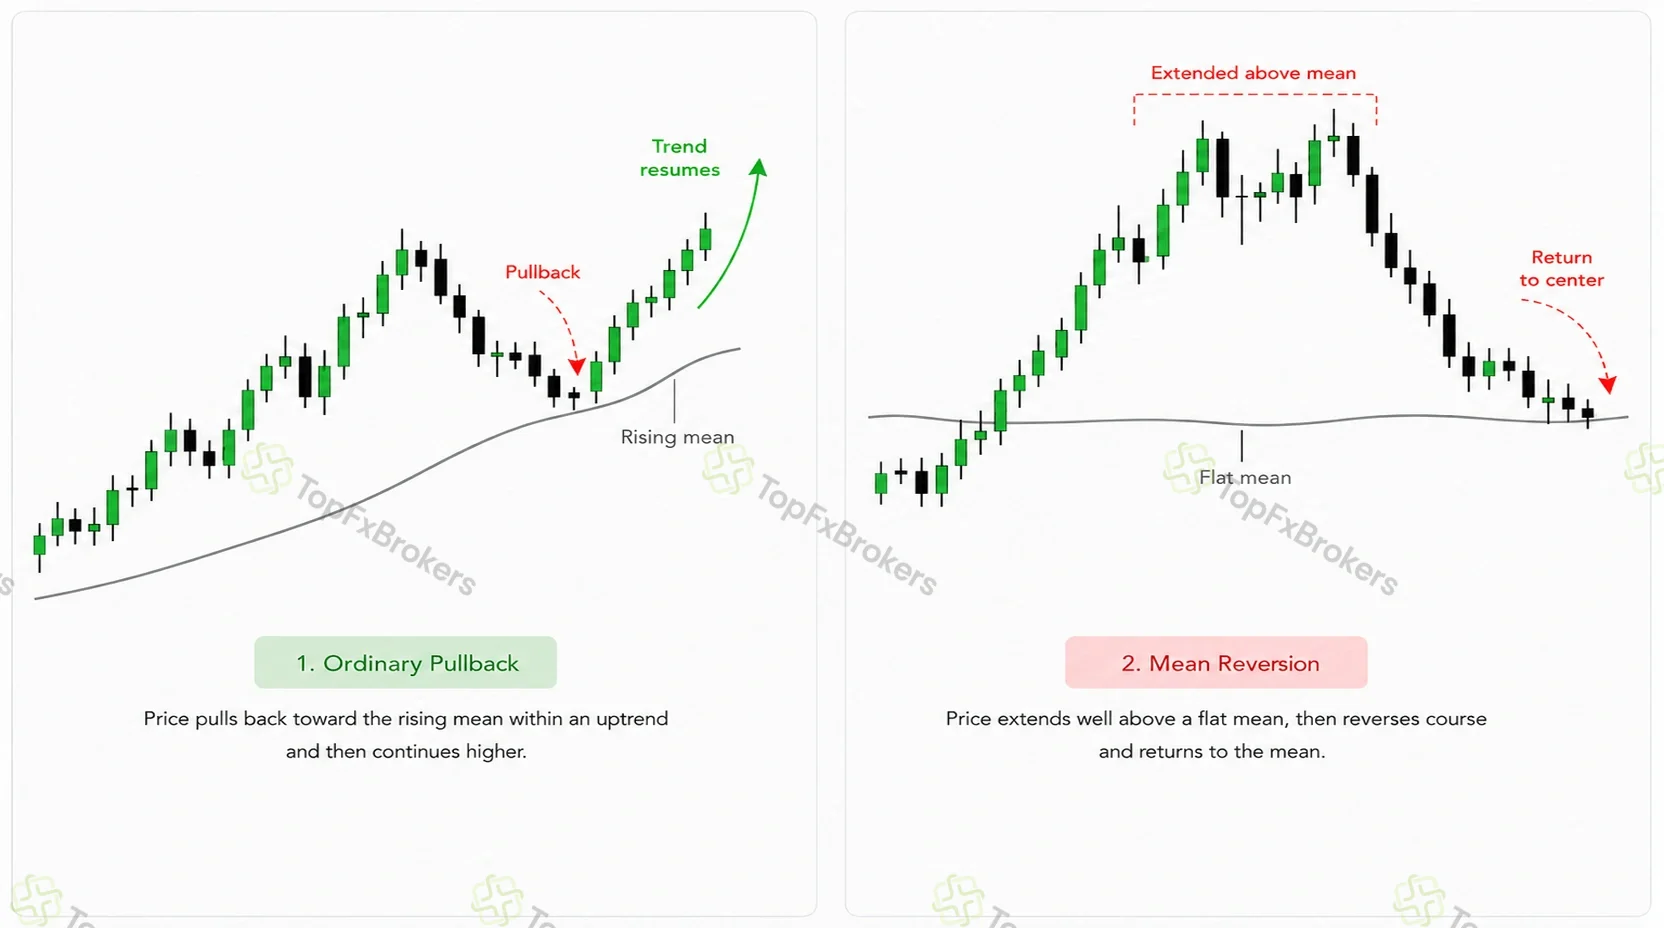
A pullback is a temporary movement against an established trend. A mean-reversion trade expects a measured deviation to contract toward a reference value. The ideas can overlap, but they are not identical.
Suppose EUR/USD is trading above a rising 50-period moving average in a clear uptrend. Buying a decline toward that average is primarily a trend-following pullback trade because the larger expectation is for the uptrend to resume.
Selling EUR/USD because it has moved far above a flat average is a countertrend mean-reversion trade. The expected profit comes from a return toward the center rather than continuation in the larger direction.
The distinction changes the invalidation logic. A range trader generally exits when price becomes accepted outside the range. A trend-pullback trader may tolerate a deeper retracement while the higher-timeframe trend remains intact. The strategies covered below focus primarily on range-based and countertrend reversion.
An Extreme Reading Is Not Automatically a Trading Edge
An extreme observation may be followed by a less extreme one, but that alone does not make the movement profitable to trade. The original deviation may contain temporary noise, yet it may also reflect changing volatility, new information, or a new equilibrium.
A credible edge requires evidence that comparable deviations have contracted frequently and quickly enough to cover losing trades and execution costs across more than one period or setting. The result should not depend on one currency pair, one year, one exact threshold, or a small number of unusually favorable trades.
An extreme reading is therefore a condition to investigate rather than an entry signal. A position becomes justified only when the surrounding regime remains suitable and price provides the specified confirmation.
When Mean Reversion Works - and When It Breaks
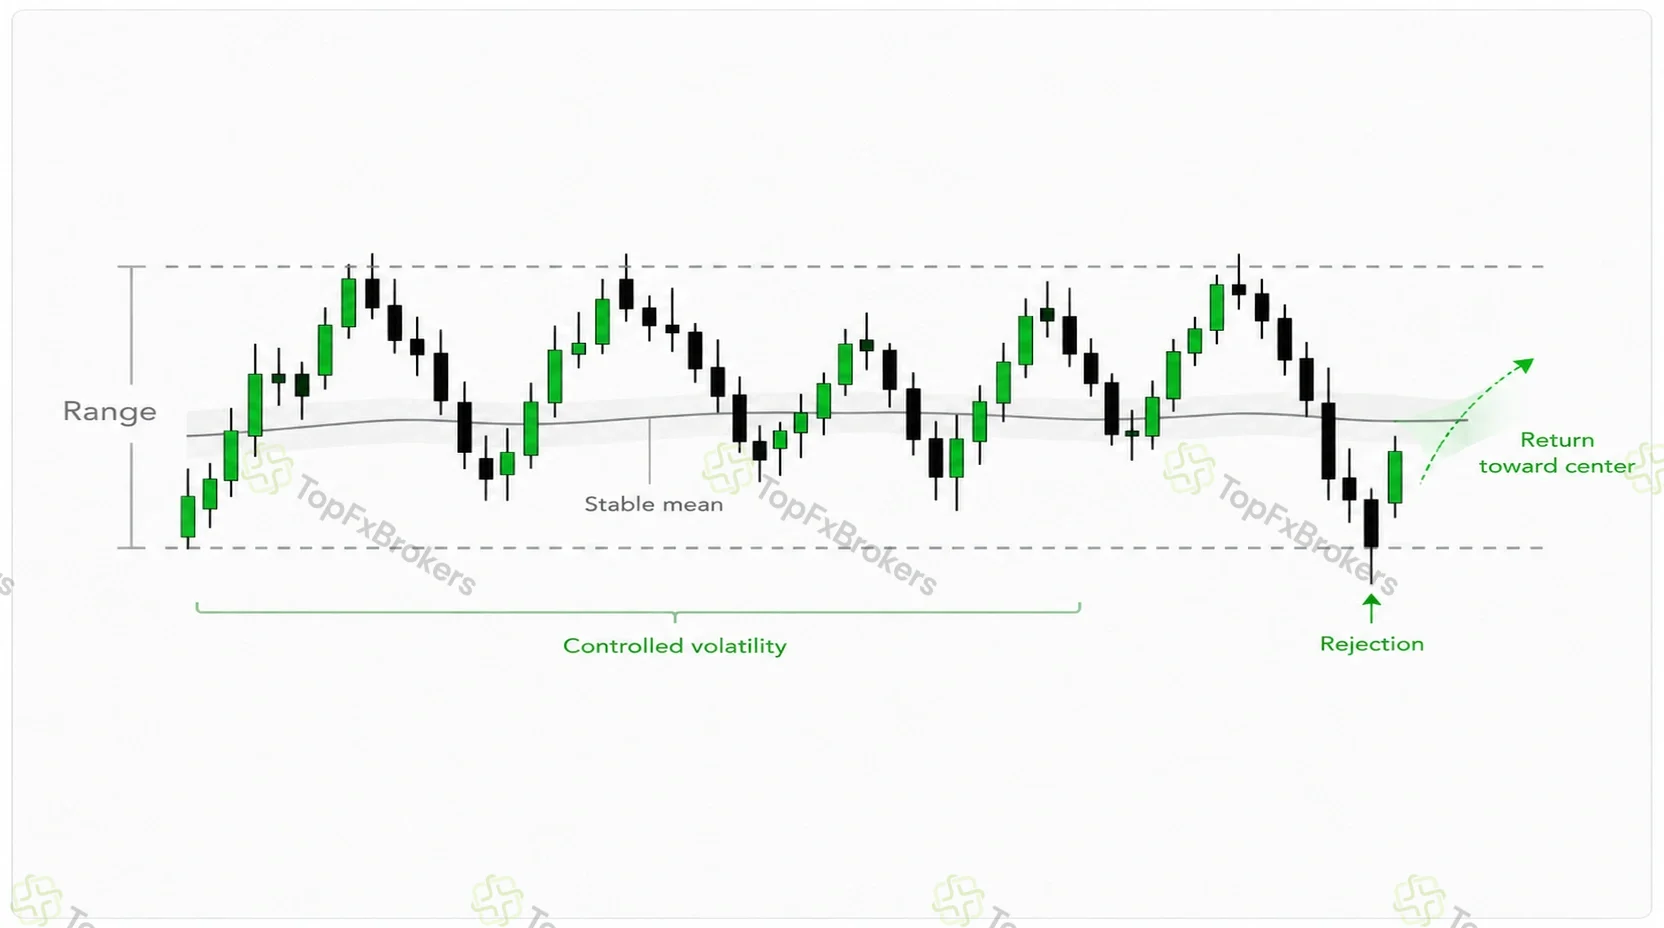
Mean reversion is most plausible when price repeatedly moves around a stable center. It becomes less reliable when participants begin accepting a new price area and the center itself starts changing. Repeated crossings, controlled volatility, prior rejection of comparable extremes, and a reachable target all strengthen the case for reversion.
The largest deviation is not necessarily the best opportunity. A moderate movement inside a mature range may be more tradeable than a dramatic movement caused by a surprise announcement. The first is a deviation within an established regime; the second may signal that the regime has ended.
Conditions That Support Reversion
A visible range is more credible when price has reacted near both boundaries and traveled through the center several times. It should be wide enough to provide meaningful reward after spread and slippage and should not be based on one or two isolated turning points.
The reference also needs to remain stable enough to function as a realistic target. A gentle slope may be acceptable, but a steep rise or fall suggests that directional pressure is becoming dominant. When small changes in the lookback produce completely different conclusions, the setup may depend too heavily on an arbitrary setting.
Volatility provides another important distinction. Price can be unusually stretched without becoming disorderly. A deviation accompanied by stabilizing candle ranges may still support reversion. Consecutive wide candles, rapidly expanding volatility bands, and widening spreads are more consistent with a breakout or information-driven repricing.
Finally, the market needs to demonstrate rejection. A close back inside a volatility band, a failed breakout, or a minor structure break away from the extreme confirms that movement toward the center has begun. Confirmation does not guarantee that the target will be reached, but it offers more information than a threshold touch alone.
How a Mean-Reversion Setup Fails
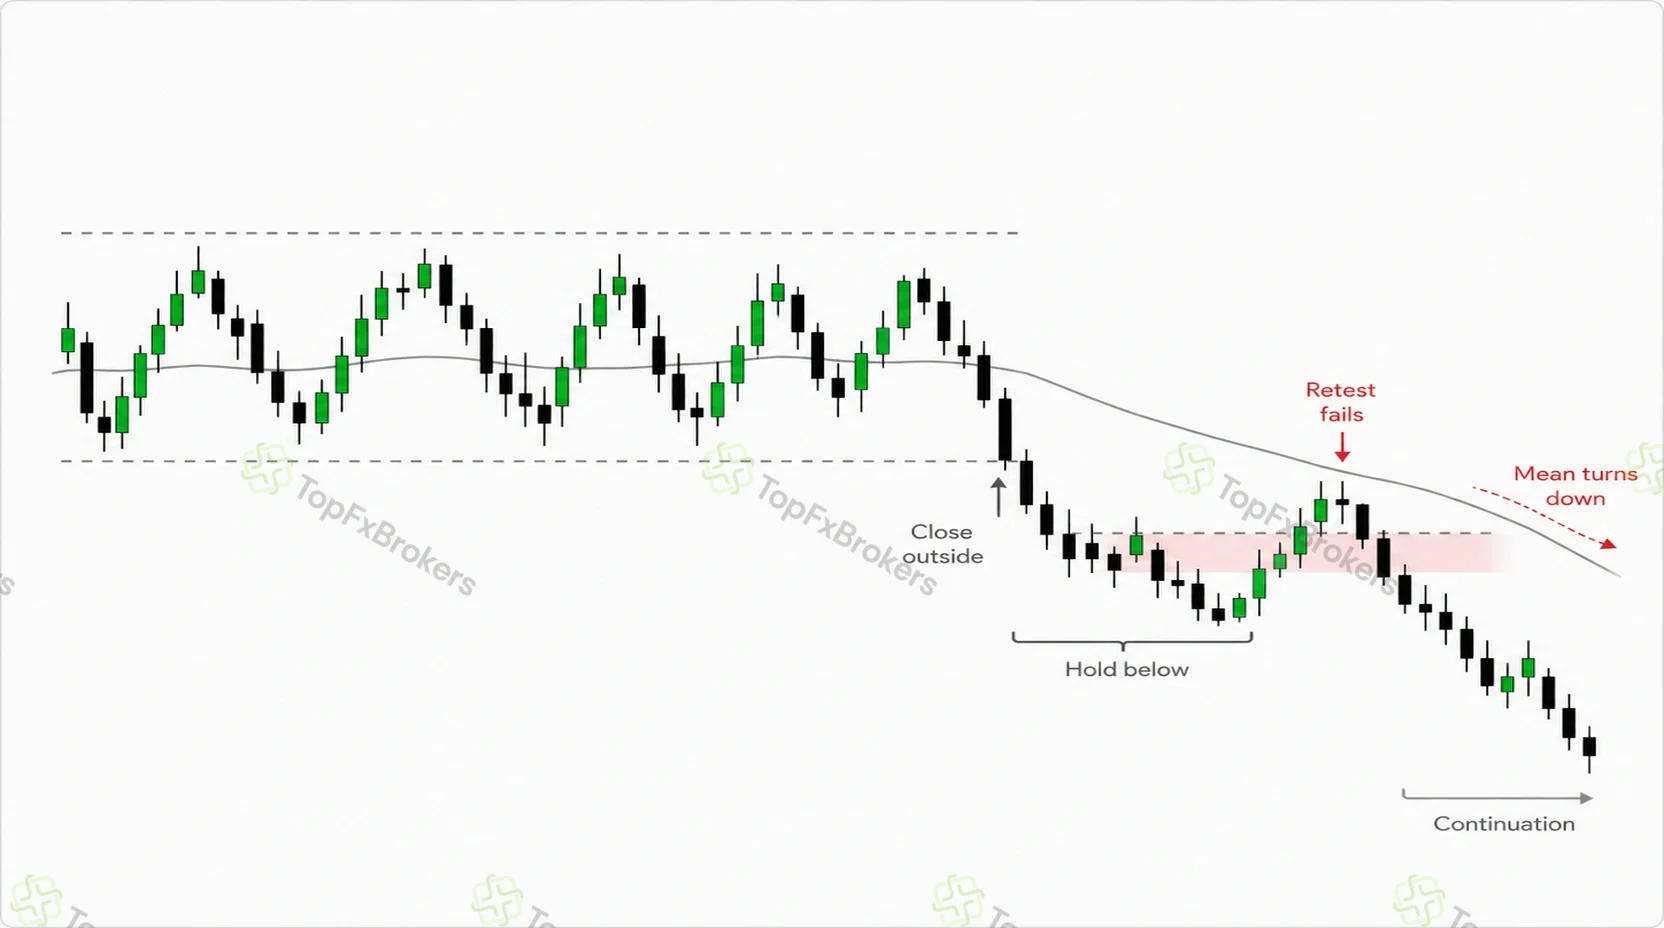
A brief wick through support or resistance does not necessarily invalidate the range. A more decisive failure develops when price closes outside the structure, remains beyond it, retests the former boundary from the other side, and then continues in the breakout direction.
The reference may simultaneously begin sloping toward the breakout, candle ranges may expand, and attempts to return inside the old structure may fail. Together, these developments show that the previous equilibrium is losing relevance.
Once the market accepts prices beyond the invalidation area, a larger deviation is not a reason to add. The original trade thesis has ended. Any later continuation trade represents a separate setup with a new entry, stop, and target.
News and Central-Bank Risk
Foreign-exchange prices are highly sensitive to changes in monetary-policy expectations. Interest-rate decisions, central-bank guidance, inflation releases, employment reports, intervention, and political developments can change both the level and volatility of a currency pair.
A technically stretched market can remain stretched while participants process new information. Macro news may affect exchange rates directly and through order flow, so the size of the deviation alone cannot determine whether it should be faded.
Before entering, confirm whether a high-impact announcement is imminent, whether the movement followed an unexpected policy signal, and whether price has returned inside the former structure after the event. The relevant question is not whether the news has already moved price "too far." It is whether the conditions that made the chosen mean useful still exist.
Choosing a Currency Pair and Timeframe
No currency pair or timeframe permanently provides the best mean-reversion opportunities. Suitability changes with liquidity, volatility, policy expectations, and the market's current structure.
Choosing a Currency Pair
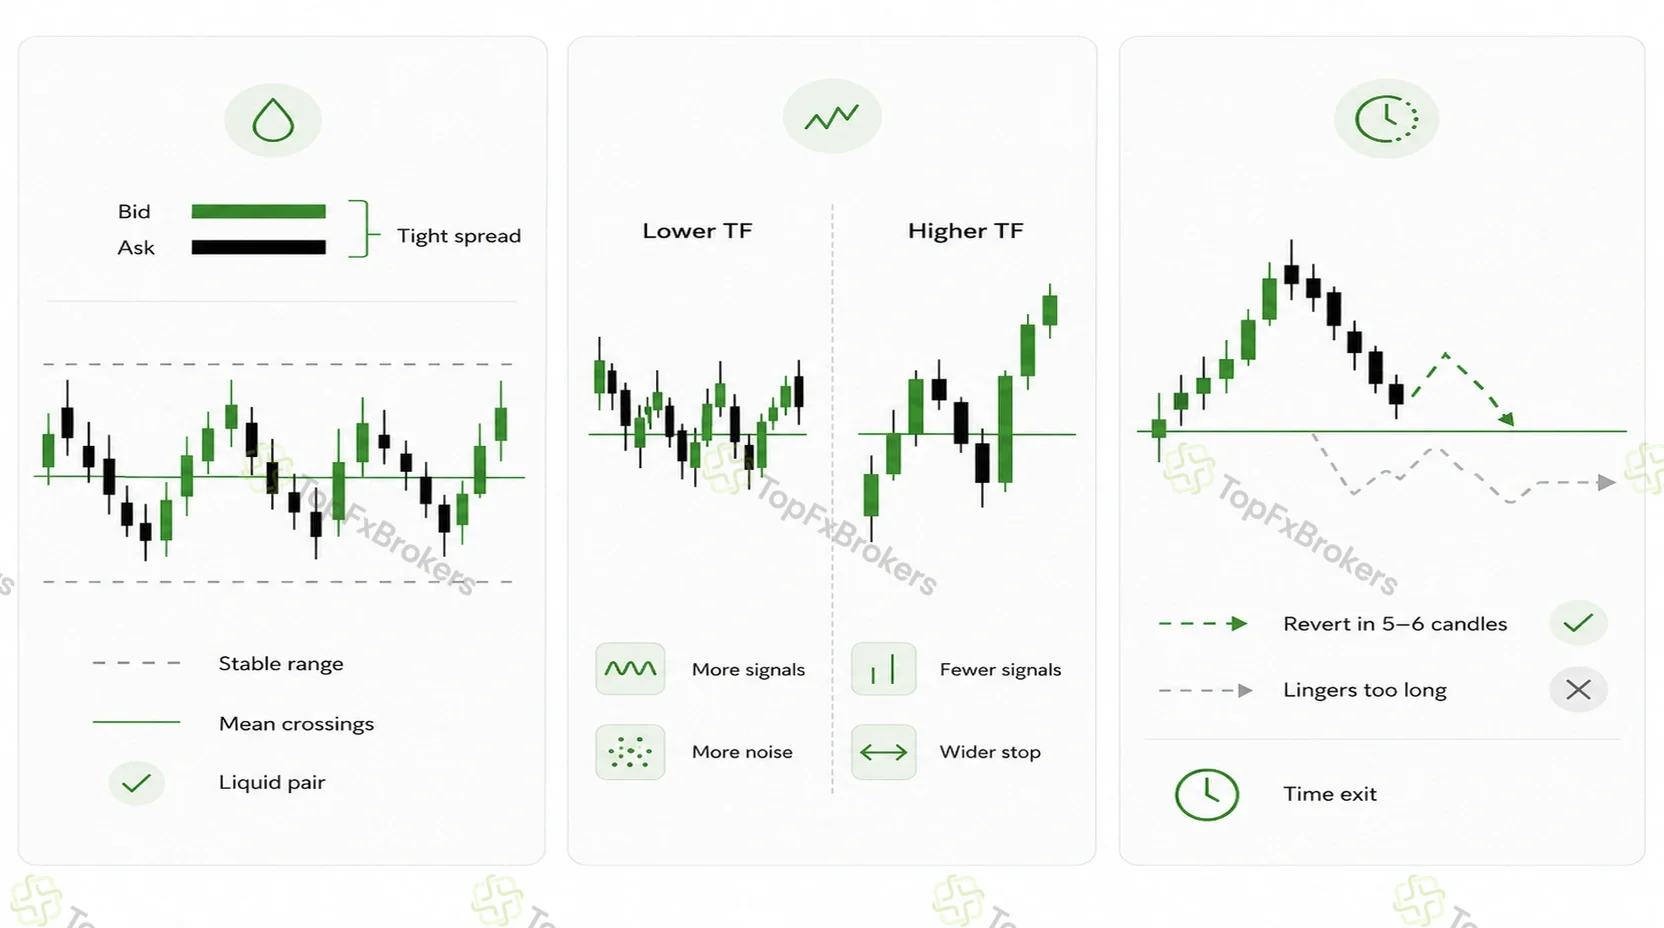
Liquid pairs are generally easier to test because execution costs are often smaller relative to the available movement. Actual broker data matters more than a generic ranking, however. A strategy targeting a modest intraday movement can lose much of its advantage if the spread widens during the period in which the signal normally appears.
Range stability deserves equal attention. Review how often price crosses the proposed mean, how frequently comparable deviations contract, and how often the range fails. A pair that spent several months rotating cleanly can begin trending when monetary-policy expectations diverge.
The average reversion must also be large enough after costs. A pair that frequently retraces ten pips may be less attractive than one that reverts less often but offers a larger net target. Results should remain broadly reasonable across nearby lookbacks and thresholds. Dependence on one exact setting is a warning that the apparent edge may reflect historical noise.
No pair should be classified as permanently mean-reverting. Selection should depend on current structure and results observed under the intended trading conditions.
Choosing the Timeframe
Lower timeframes generate more signals but are more sensitive to spread, slippage, market noise, and the unknown order of price movements within each candle. Higher timeframes reduce the relative effect of transaction costs but lead to wider stops, longer holding periods, greater exposure to scheduled events, and possible overnight financing.
The timeframe should match the observed speed of reversion. If successful setups normally reach the mean within five or six candles, holding an unsuccessful position for thirty candles because price may eventually recover changes the strategy into an uncontrolled longer-term trade.
Compare the typical holding time of winners with that of failed setups. A predefined time exit prevents a short-horizon idea from becoming an indefinite recovery attempt.
How to Define and Measure the Mean
Measurement should answer three practical questions: what represents the current center, how unusual the deviation is, and whether comparable movements have historically contracted under similar conditions.
Methods for Defining the Mean
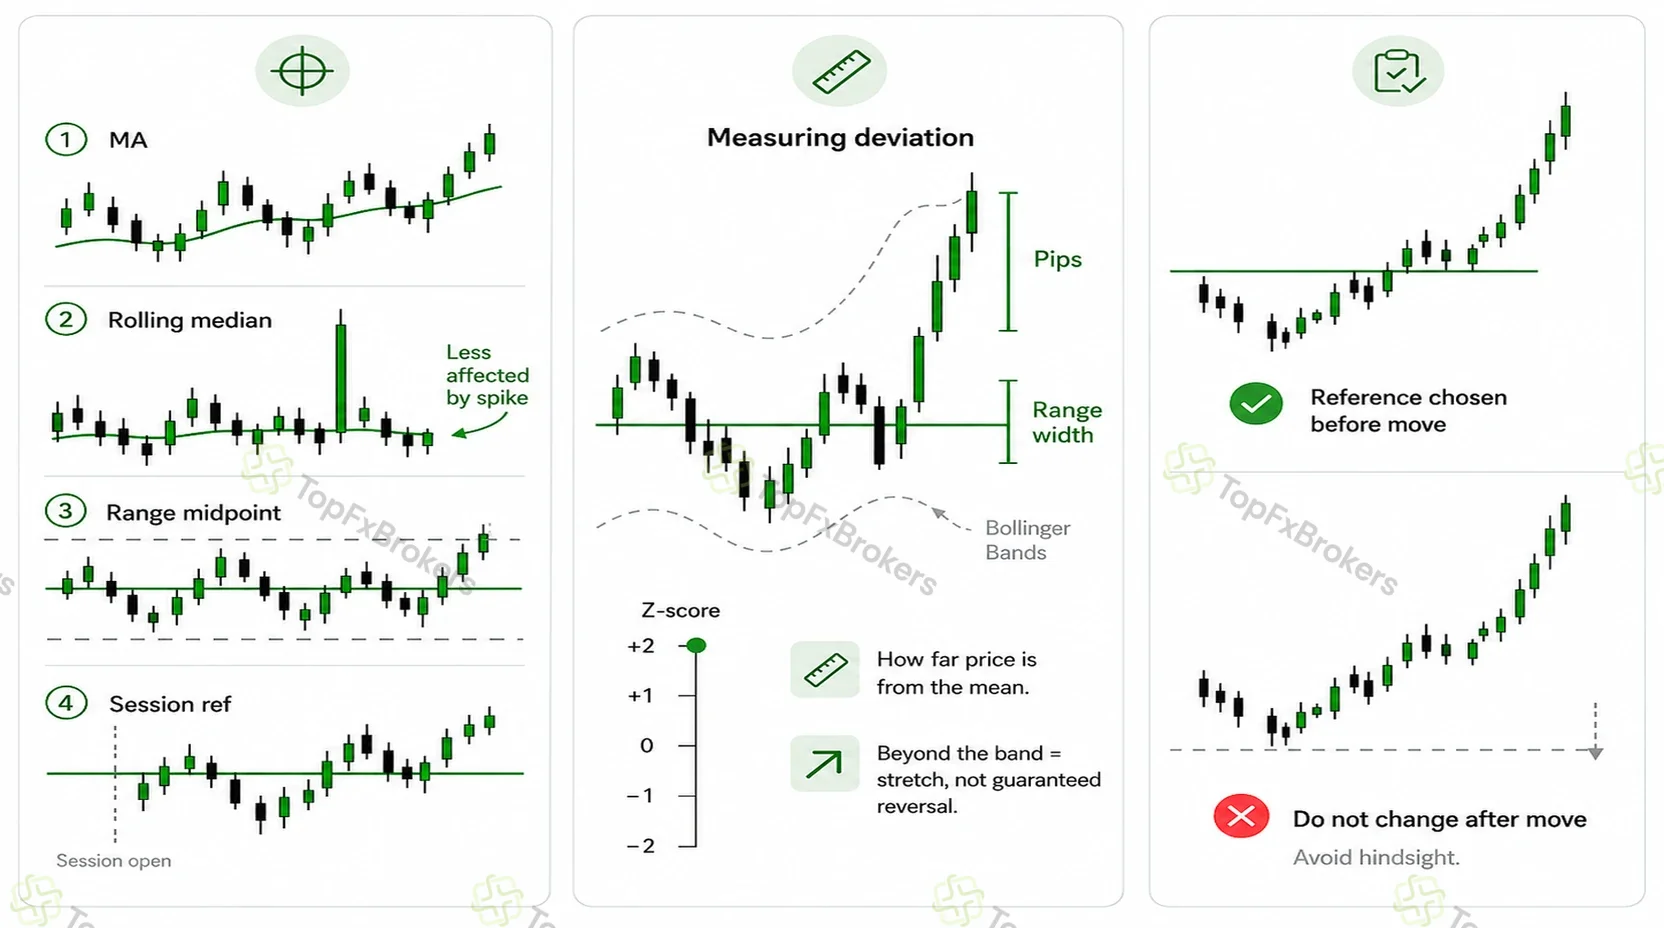
A simple moving average is transparent and easy to reproduce. It gives equal weight to each observation in the chosen period, although its value can change noticeably when an older price leaves the calculation.
An exponential moving average reacts more quickly to recent prices. That responsiveness can help when conditions evolve gradually, but it also allows the target to move toward price before a meaningful reversal develops.
A rolling median is less affected by one extreme candle and may provide a steadier center when the sample contains abrupt spikes. A range midpoint offers a structural reference based on repeated support and resistance rather than a calculated average.
Intraday strategies may use the session open, session midpoint, overnight range, or a platform-derived volume-weighted benchmark.
The reference must be selected before the signal. Switching from one average to another after entry because the new level provides a more convenient target introduces hindsight and makes the strategy impossible to evaluate consistently.
Measuring the Deviation
A deviation may be expressed in pips, relative to recent average movement, against the width of a range, or through volatility-sensitive bands. A platform Z-score can also summarize how far the current observation lies from its recent center.
The objective is comparison rather than certainty. A movement that appears large in pips may be ordinary during a volatile week, while a smaller movement can be unusual during a quiet consolidation. Common thresholds provide starting points for testing, not universal reversal levels.
Bollinger Bands are useful because they combine a moving average with volatility-sensitive boundaries. A move beyond the outer band shows that price is stretched relative to the selected lookback. It does not show that the trend has ended, which is why market context and a close back inside the band remain important.
Is the Behavior Consistent Enough to Trade?
A practical evaluation does not require turning the article into a statistical textbook. Useful evidence includes frequent crossings of the selected mean, comparable reversion times across many examples, relatively stable range width, acceptable performance in different periods, and results that survive modest changes in settings.
The analysis must also determine whether the apparent behavior disappears after costs or during unfavorable regimes. A relationship that appears convincing across the full chart may depend almost entirely on one extended range.
A Five-Question Forex Mean-Reversion Filter
- Is the reference mean stable? The mean should be flat or changing slowly enough to remain a realistic target. If a minor change in lookback completely changes the conclusion, the setup may rely too heavily on one setting.
- Has price reverted under similar recent conditions? Review comparable deviations in the same regime. Note whether price returned, how long the movement took, and whether a logical stop would have survived.
- Is volatility controlled? A large deviation during stable or settling volatility is more suitable than one accompanied by expanding ranges, widening spreads, and persistent directional candles.
- Has price confirmed rejection of the extreme? Confirmation may be a close back inside a band, a failed breakout, a stronger candle away from the extreme, or a minor structure break toward the mean.
- Can the mean be reached before invalidation? Compare the net target distance with the logical stop and expected execution costs. A close target paired with a distant stop may require an unrealistic win rate.
The filter turns a stretched price into a structured decision. A "no" does not automatically rule out the trade, but it identifies the weakest assumption in the setup.
Five Mean Reversion Strategies for Forex
The following methods are frameworks rather than universal settings. Each one must be evaluated with the intended pair, timeframe, session, and execution data.
Moving-Average Deviation Strategy
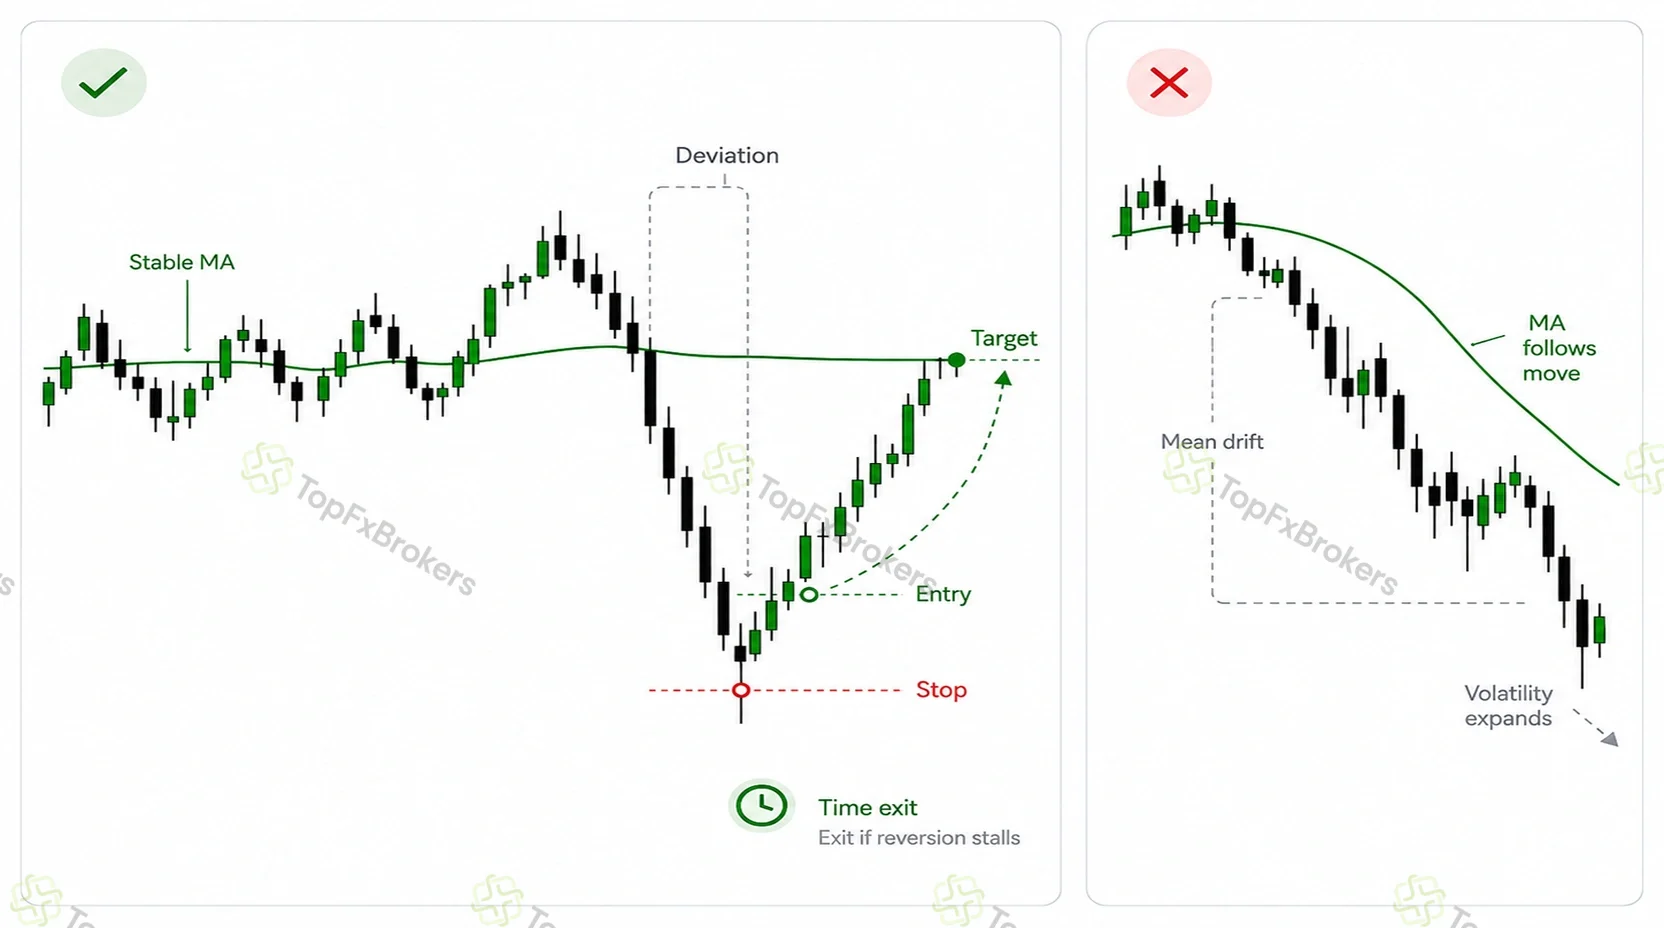
This strategy works best when price has crossed a stable moving average repeatedly and then travels an unusual distance away without developing the volatility and structure of a strong trend.
Entry follows evidence that the movement is losing strength. That evidence might be a close toward the average, reclamation of a nearby level, or a minor reversal in market structure. The target is generally the current mean or a level just before it, while the stop sits beyond the extreme or the point where continuation would invalidate the expected return.
A time exit is essential. If price remains near the entry while the average begins following the original movement, the expected reversion is no longer developing as tested.
Mean drift is the principal weakness. A steepening average and continued volatility expansion indicate that the reference is following a new trend rather than attracting price back toward it.
Bollinger Band Rejection Strategy
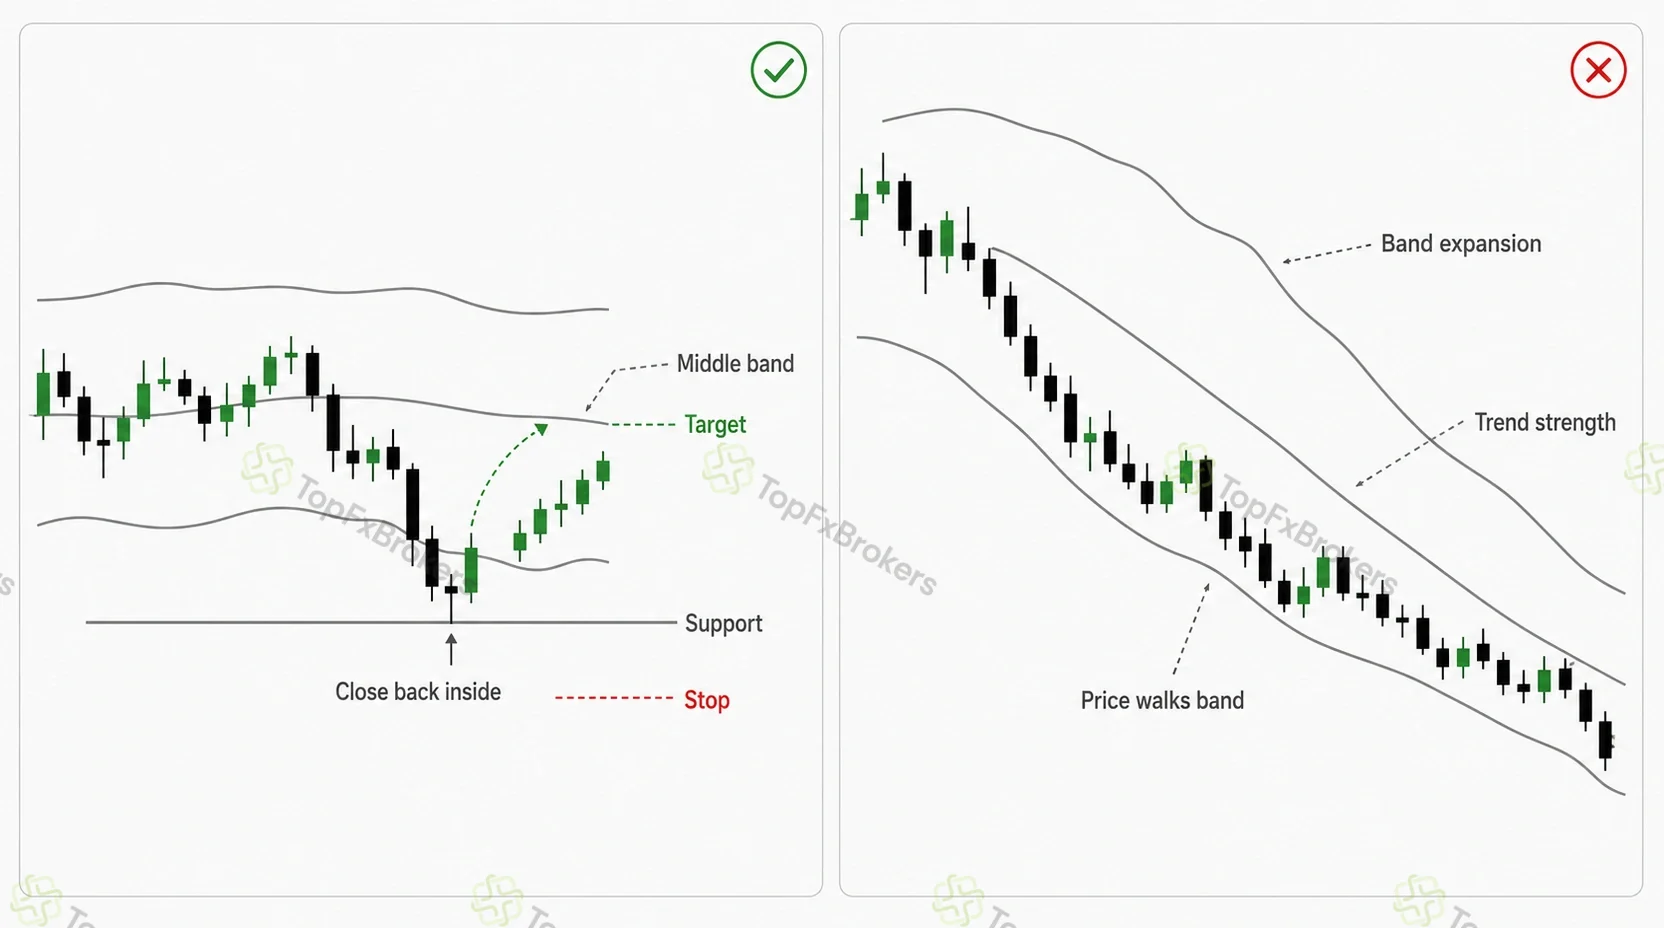
The common mistake with Bollinger Bands is treating every outer-band touch as a reversal signal. In a directional market, price can remain near an expanding band for many candles.
A stronger setup requires a flat or gently sloped middle band, stable rather than rapidly increasing band width, and a close back inside the outer band. Nearby support or resistance can improve the context when it was identified before the reversal appeared.
The target normally lies at or just before the middle band. The stop belongs beyond the rejection extreme and the structural point where continued movement would show that price is walking the band rather than returning.
When the bands expand sharply and price holds near the outside boundary, the indicator is describing trend strength rather than a temporary deviation.
Range-Extreme Reversal
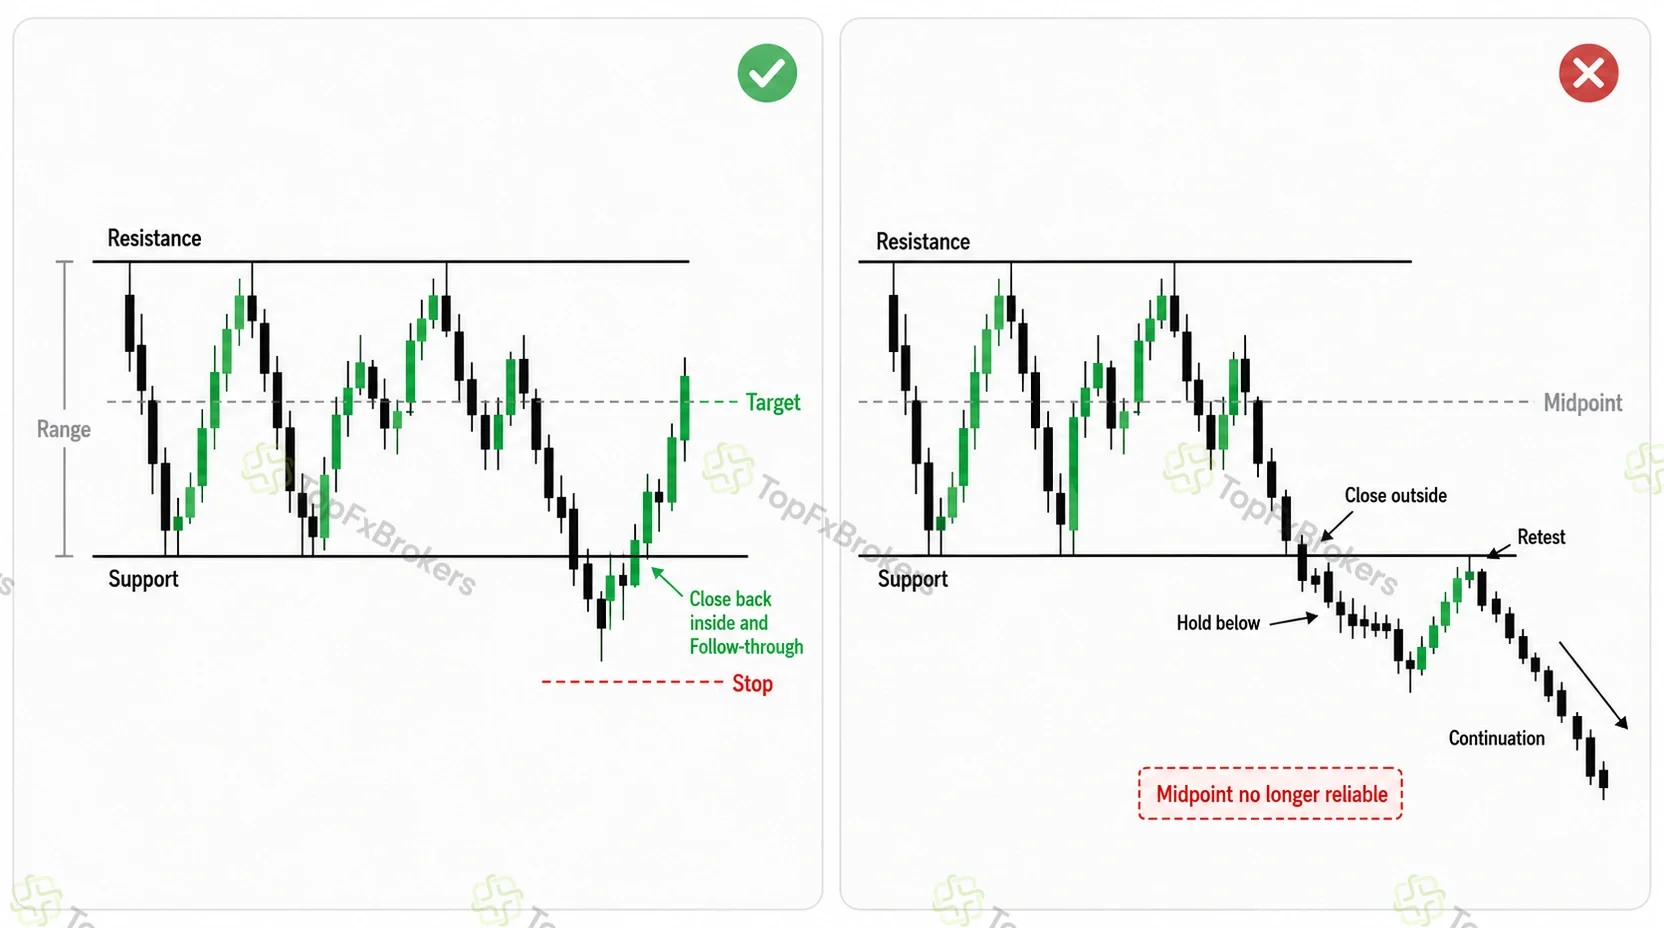
Market structure defines this approach. The range must contain several reactions at both boundaries and repeated movement through its center. A narrow or loosely defined consolidation may not provide enough reward after costs.
A long setup can develop when price briefly breaks below support and then closes back inside. A short setup follows the equivalent failure above resistance. A follow-through candle or minor reversal structure confirms that the boundary has been rejected.
The primary objective is the range midpoint. The stop sits beyond the area where the failed breakout would become genuine acceptance outside the range. Holding for the opposite boundary can be tested as a separate exit method, but it should not replace the original target after the position becomes profitable.
The decisive failure sequence is the close, hold, retest, and continuation beyond the range described earlier. Once that occurs, the midpoint is no longer a reliable target.
Oscillator Re-Entry Strategy
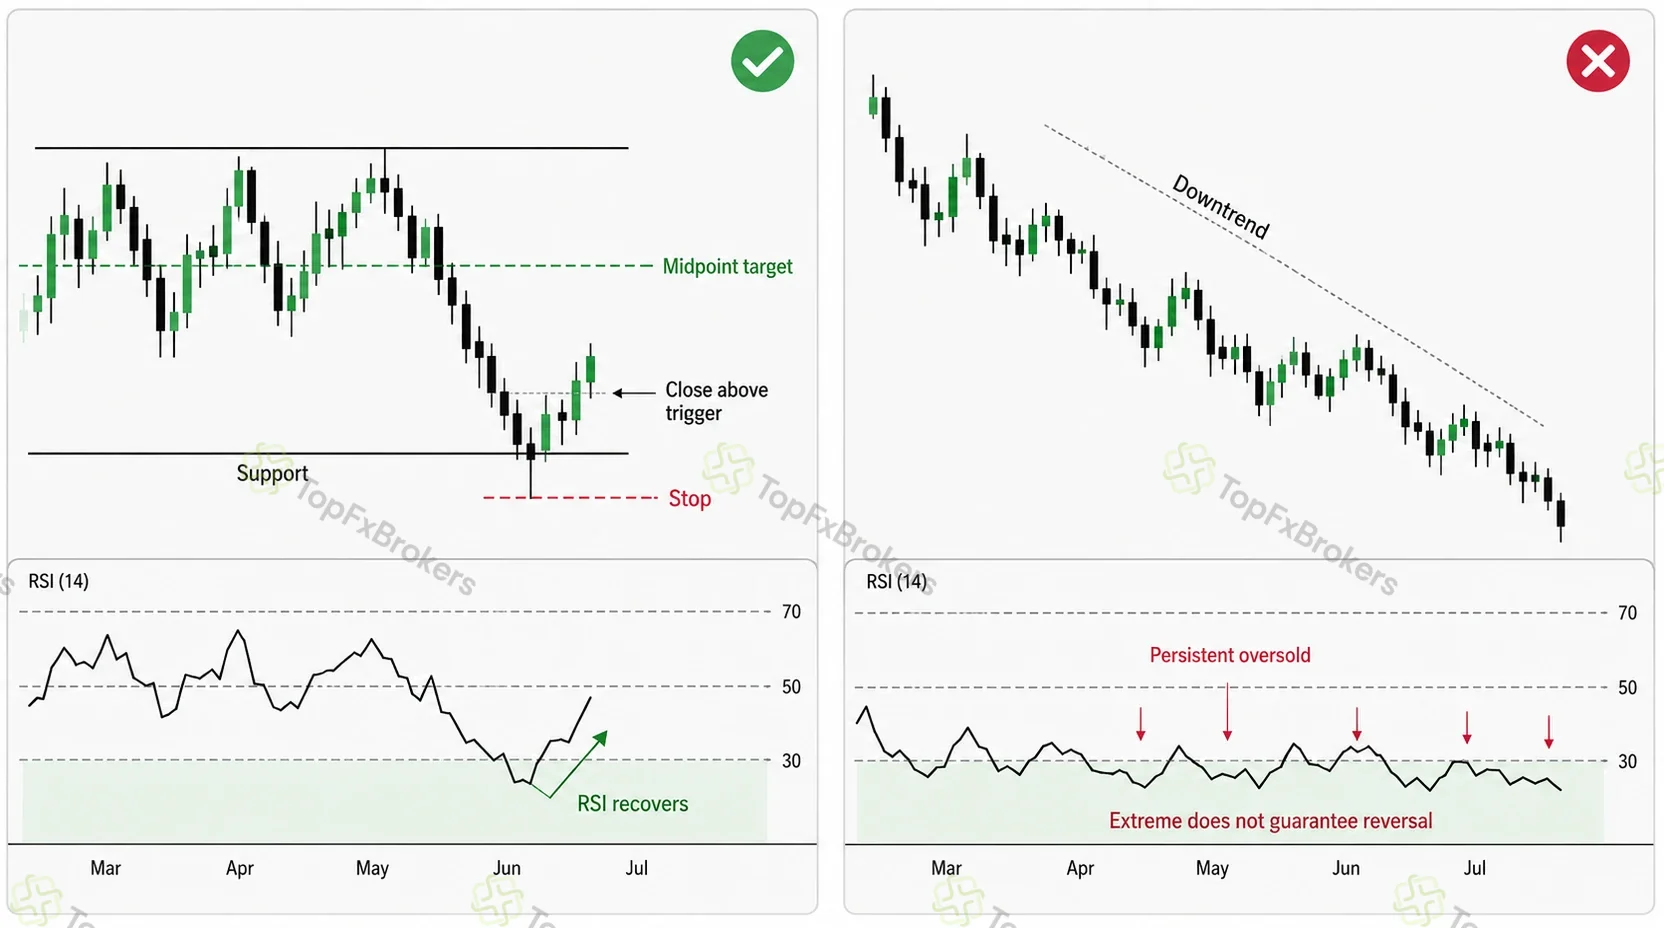
RSI and stochastic oscillators measure stretched momentum, not an obligation for price to reverse. Persistent trends can keep either indicator overbought or oversold for an extended period.
A higher-quality setup combines a stable range or flat mean, an oscillator extreme, and recovery in both momentum and price. A possible long trade appears when price reaches established support while RSI is oversold, followed by RSI recovery and a close above a predefined price trigger.
The range midpoint or moving average provides the target, and the structural low defines invalidation. Divergence may strengthen the context when price reaches a new extreme while the oscillator does not, but it cannot repair a broken range or unfavorable reward relative to risk.
The danger is not the oscillator itself, but the assumption that an extreme reading can force a directional market to reverse.
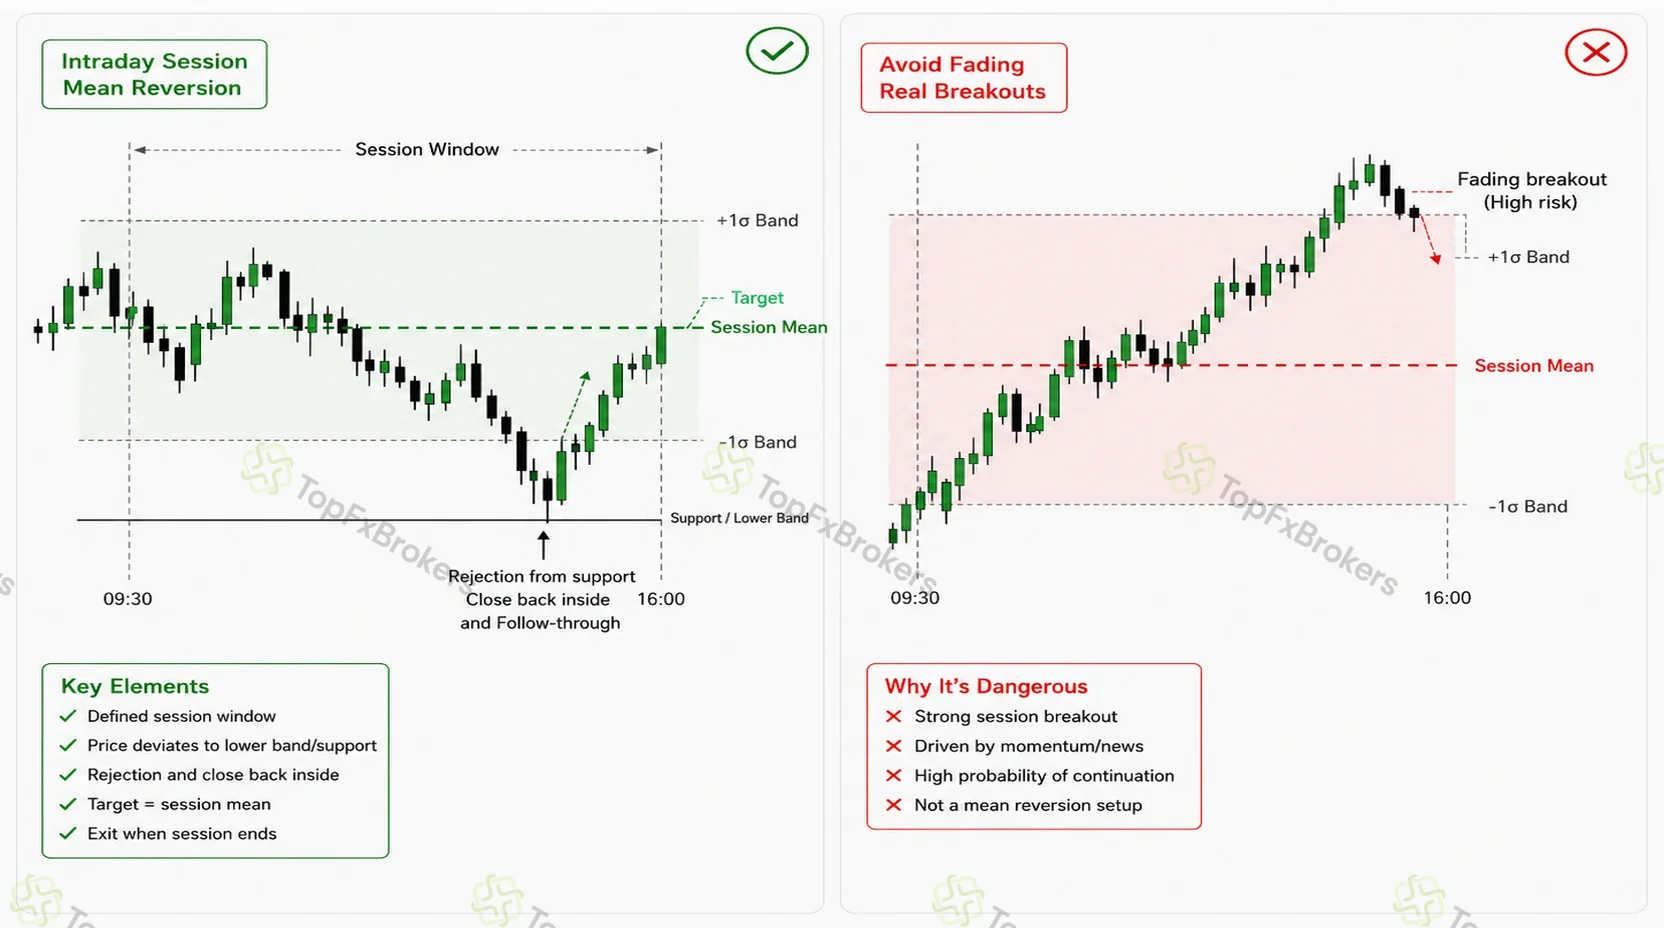
Intraday Session Mean Reversion
A session-based strategy begins with a reference that is meaningful only during a defined trading window. The session open, midpoint, overnight range, rolling average, or a platform-based volume benchmark may provide the center.
After defining the session and reference, the deviation is measured and price must show rejection. Major announcement periods should either be excluded or evaluated separately. The target is the session mean or a conservative portion of the distance, and the position closes when the session logic expires.
The main danger is fading the beginning of a genuine session breakout. A strong London or New York movement driven by new information should not be treated like a routine deviation from an overnight range.
Mean-Reversion Strategy Comparison
The appropriate method depends on what currently defines equilibrium. A repeated horizontal structure favors the range-extreme approach, a stable calculated center favors moving-average or Bollinger Band methods, and a consistent intraday benchmark favors session reversion. Select the framework before the deviation appears rather than choosing whichever indicator best explains a completed chart.
Worked Example: EUR/USD Mean-Reversion Trade
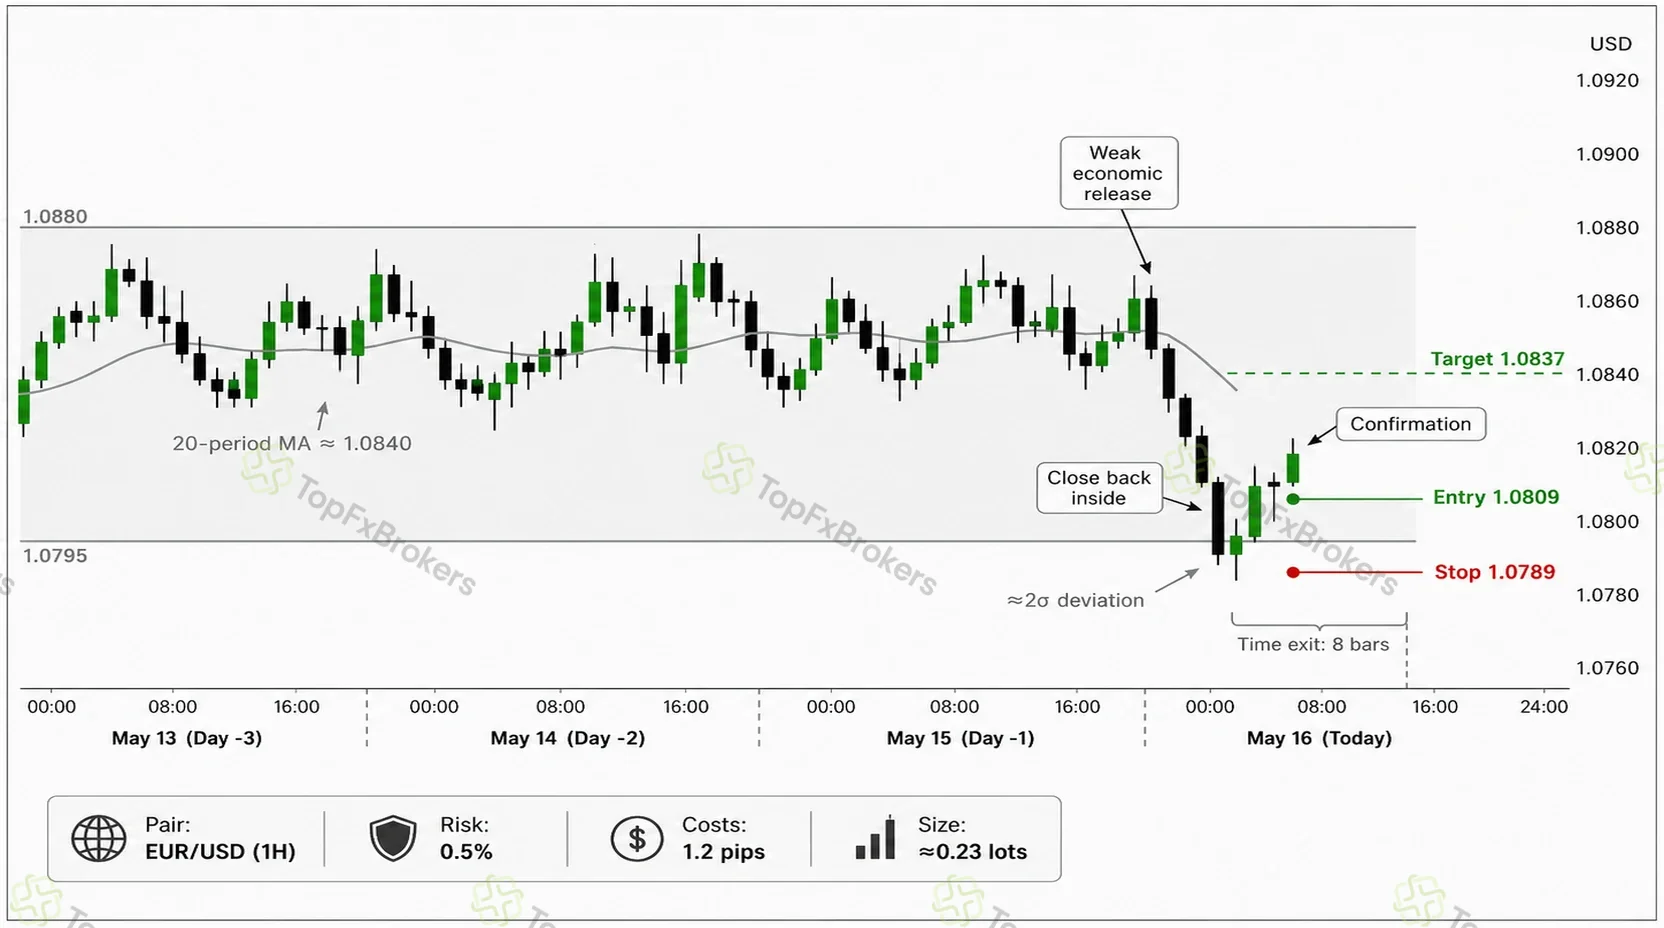
Assume EUR/USD is trading on a one-hour chart. During the previous three days, price has repeatedly crossed a 20-period moving average and remained inside a range between approximately 1.0795 and 1.0880. The average is near 1.0840 and has changed very little during the previous four completed candles.
A weaker-than-expected economic release pushes EUR/USD toward 1.0800. The platform shows price approximately two standard deviations below the 20-period mean. That reading identifies a meaningful deviation, but it does not justify an immediate purchase.
The one-hour candle trades below 1.0800 and then closes back above the range floor. The following candle also closes higher. Volatility rose during the initial movement but is no longer expanding, the average remains almost flat, and no major announcement is scheduled during the intended holding period.
The five-question filter supports the trade. The reference is stable, similar tests have returned toward the center, volatility is settling, price has confirmed rejection, and the available movement toward the target exceeds the distance to a logical stop after estimated costs.
Trade Plan
- Pair and timeframe: EUR/USD on the one-hour chart
- Entry: Near 1.0809 after the confirmation close
- Stop: Near 1.0789, below the failed-breakout area
- Target: Near 1.0837, slightly before the moving average
- Time exit: Eight completed one-hour candles
- Risk and size: A maximum account risk of 0.5%, with position size calculated from the stop and an assumed 1.2 pips of combined spread and slippage under normal conditions
For a $10,000 account, 0.5% risk equals $50. With an effective stop of slightly more than 21 pips after estimated costs, the position would be approximately 0.23 standard lots. Rounding down prevents the planned account risk from being exceeded.
The gross target is about 28 pips, while the structural stop is approximately 20 pips away. If price reaches the target, the trade exits near the mean. If it fails to make sufficient progress within eight completed candles, the position closes even if the protective stop has not been reached.
The time exit preserves the original expectation of a relatively quick reversion. It prevents the position from becoming an open-ended bet that price will recover eventually.
A correctly filtered and properly managed setup can still reach its stop. The process is designed to define risk and improve consistency, not to identify every winning reversal in advance.
What Would Make the Same Setup Fail?
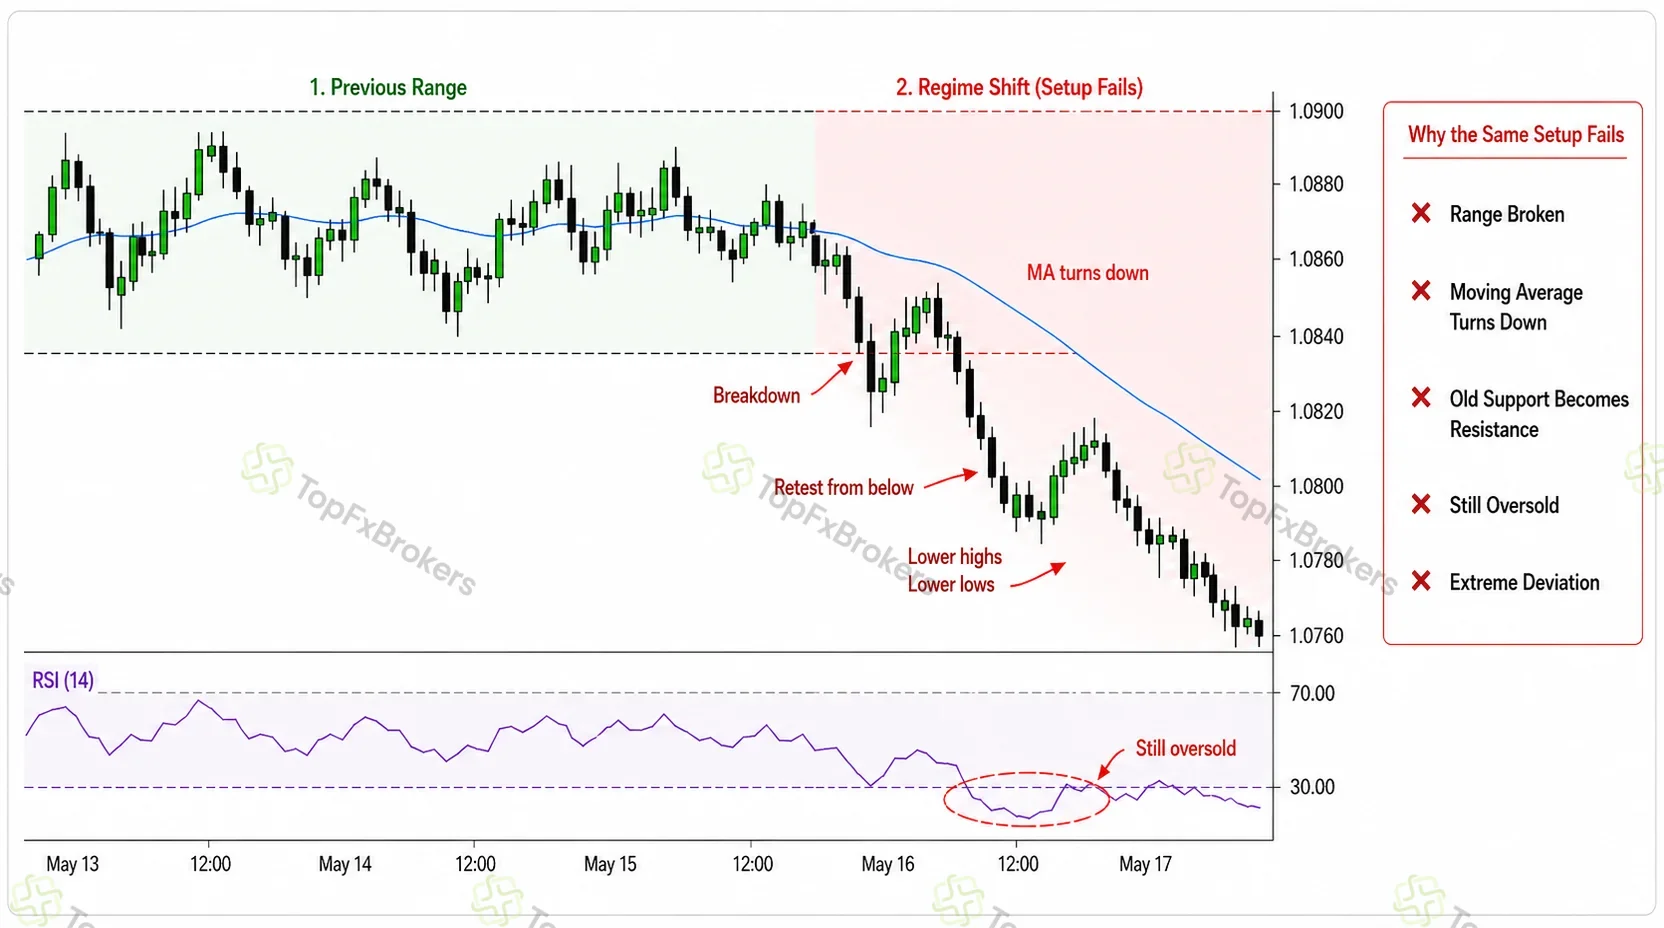
Now assume the decline follows an unexpected central-bank repricing. Price closes below the range, remains there for several candles, and retests the former support from below. The moving average begins falling, and volatility continues expanding.
The indicator may still show an extreme negative deviation, but the market context has changed. Price is no longer contained, the reference is moving lower, and old support is acting as resistance. Buying again because the deviation has increased would mean defending an equilibrium that the market is no longer recognizing.
If a long position is already open, the predetermined stop ends the trade. Any later continuation opportunity must be assessed separately.
Execution, Exits, and Risk Management
Many short-target mean-reversion systems can produce frequent modest wins interrupted by occasional larger losses. Execution and loss control therefore matter more than an attractive historical win rate.
Limit Orders vs Confirmation Entries
A limit order near the extreme can improve the entry price and increase the distance to the mean. The trade-off is that it may fill while price is still accelerating against the position. It can also remain unfilled during a fast reversal.
Confirmation entries wait for price to close back inside a band, reclaim a range boundary, or break a minor reversal level. The entry is less favorable, but the method avoids some trades based only on a threshold touch.
Whichever method is chosen must be modeled honestly. A candle touching a limit price does not prove that the order would have been filled, particularly during fast movement, thin liquidity, or spread expansion.
Choosing the Exit and Invalidation
The exit must match the original hypothesis. A strategy may close slightly before the moving mean, at the updated mean, after most of the deviation has normalized, or when the predefined time limit expires.
Partial profit at the mean and a second target may also be tested, but the secondary objective must belong to the original rules. A strategy designed to capture a return to the center should not suddenly become a full range-rotation trade after the position becomes profitable.
Invalidation belongs where the market demonstrates that the expected equilibrium is no longer controlling price. That may be beyond the rejection extreme, outside a confirmed range boundary, or past the point where the remaining reward no longer compensates for the risk.
Targets should not be extended merely because the trade is winning, and stops should not be widened because price has moved farther from the mean.
Why Averaging Down Is Dangerous
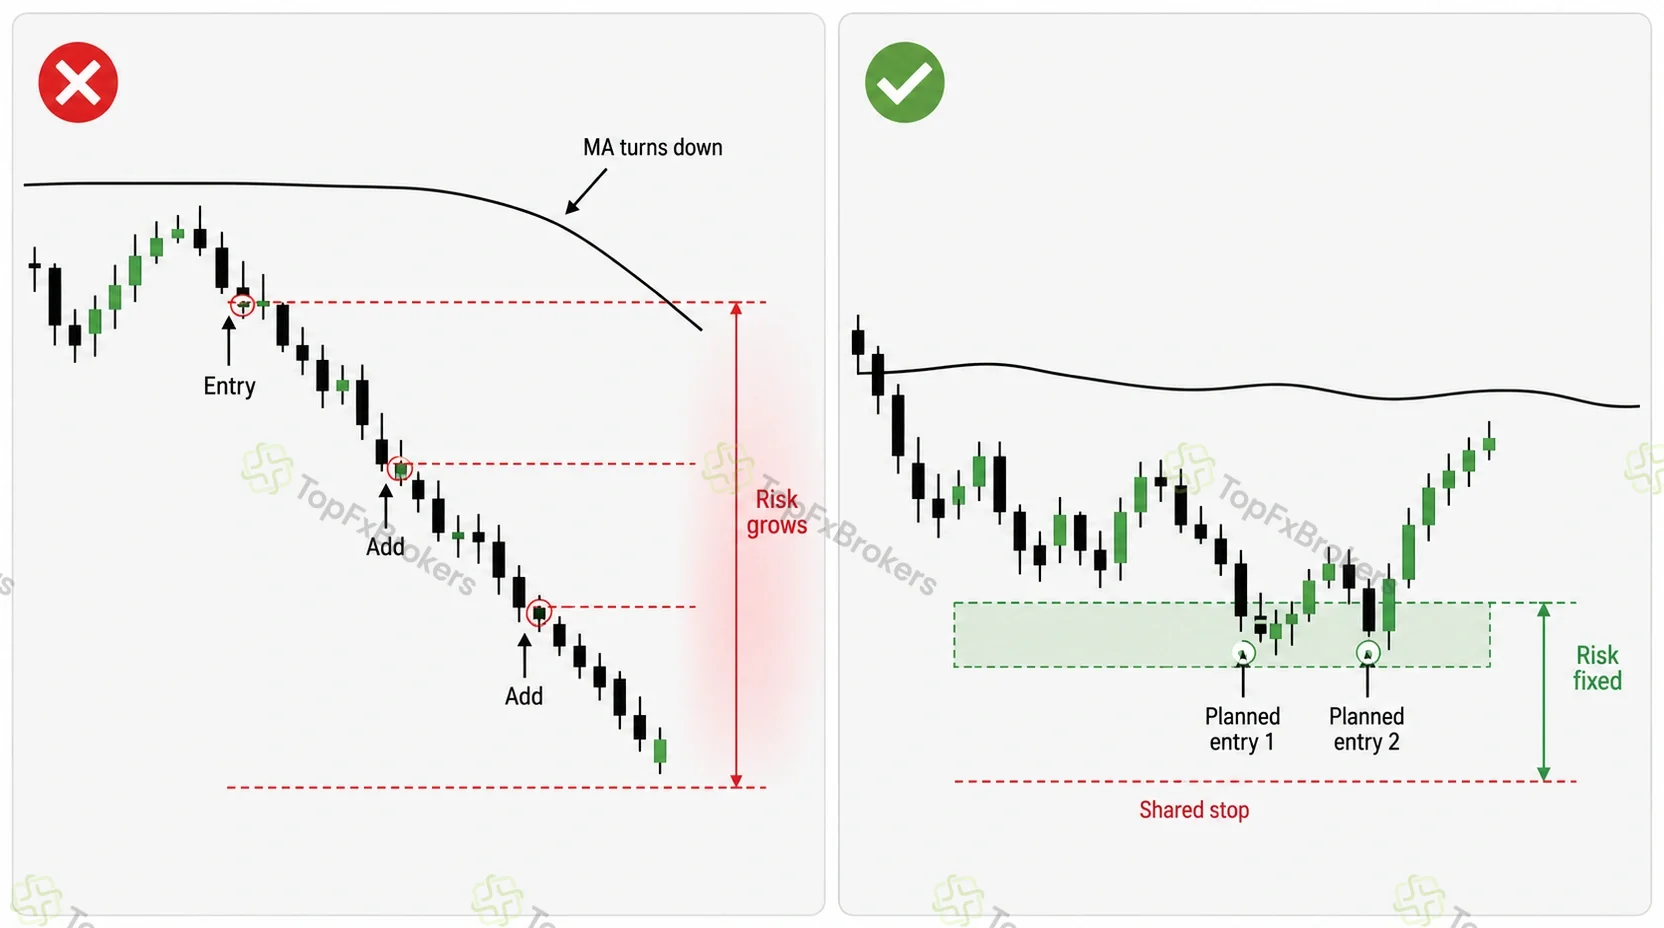
Mean reversion can create the belief that every worse price is a better opportunity. That belief encourages repeated additions or increasing position size as the trade moves into loss.
The same movement that makes the entry appear cheaper may be evidence of regime change. Exposure grows while the old mean becomes less relevant.
Adding is defensible only when the number and location of entries were planned in advance, total account risk remains fixed, and every position shares an objective invalidation point. A larger deviation does not automatically create a higher probability of reversal.
Correlated Currency Exposure
Several forex positions can express the same underlying view. Long EUR/USD, long GBP/USD, and short USD/CHF can all create meaningful short-dollar exposure.
Sizing each position independently may cause a single dollar-driven event to produce a portfolio loss much larger than expected. Risk should therefore be assessed by currency and shared factor, not only by individual trade.
Selecting the clearest setup may be safer than opening several highly related positions at full size.
Spread, Slippage, Swap, and Rollover
A modest historical edge can disappear after execution costs.
The backtest and trade plan should reflect the normal spread during the intended trading window, wider conditions around news and rollover, possible slippage, commissions, overnight financing, and missed or partial fills.
These costs matter most when targets are small. A setup that appears profitable on midpoint candles may be untradeable once actual entry and exit prices are included.
Mean Reversion vs Trend Following
The approaches can coexist at different horizons. A trader might use a higher-timeframe uptrend as a filter and buy a temporary deviation toward a shorter-term mean. That is trend-filtered pullback trading rather than an attempt to fade the larger trend.
How to Backtest a Forex Mean-Reversion Strategy
A credible backtest uses reproducible rules, executable pricing, realistic costs, varied market conditions, and data that were not used to design the strategy. Its purpose is to identify weaknesses, not to manufacture an attractive equity curve.
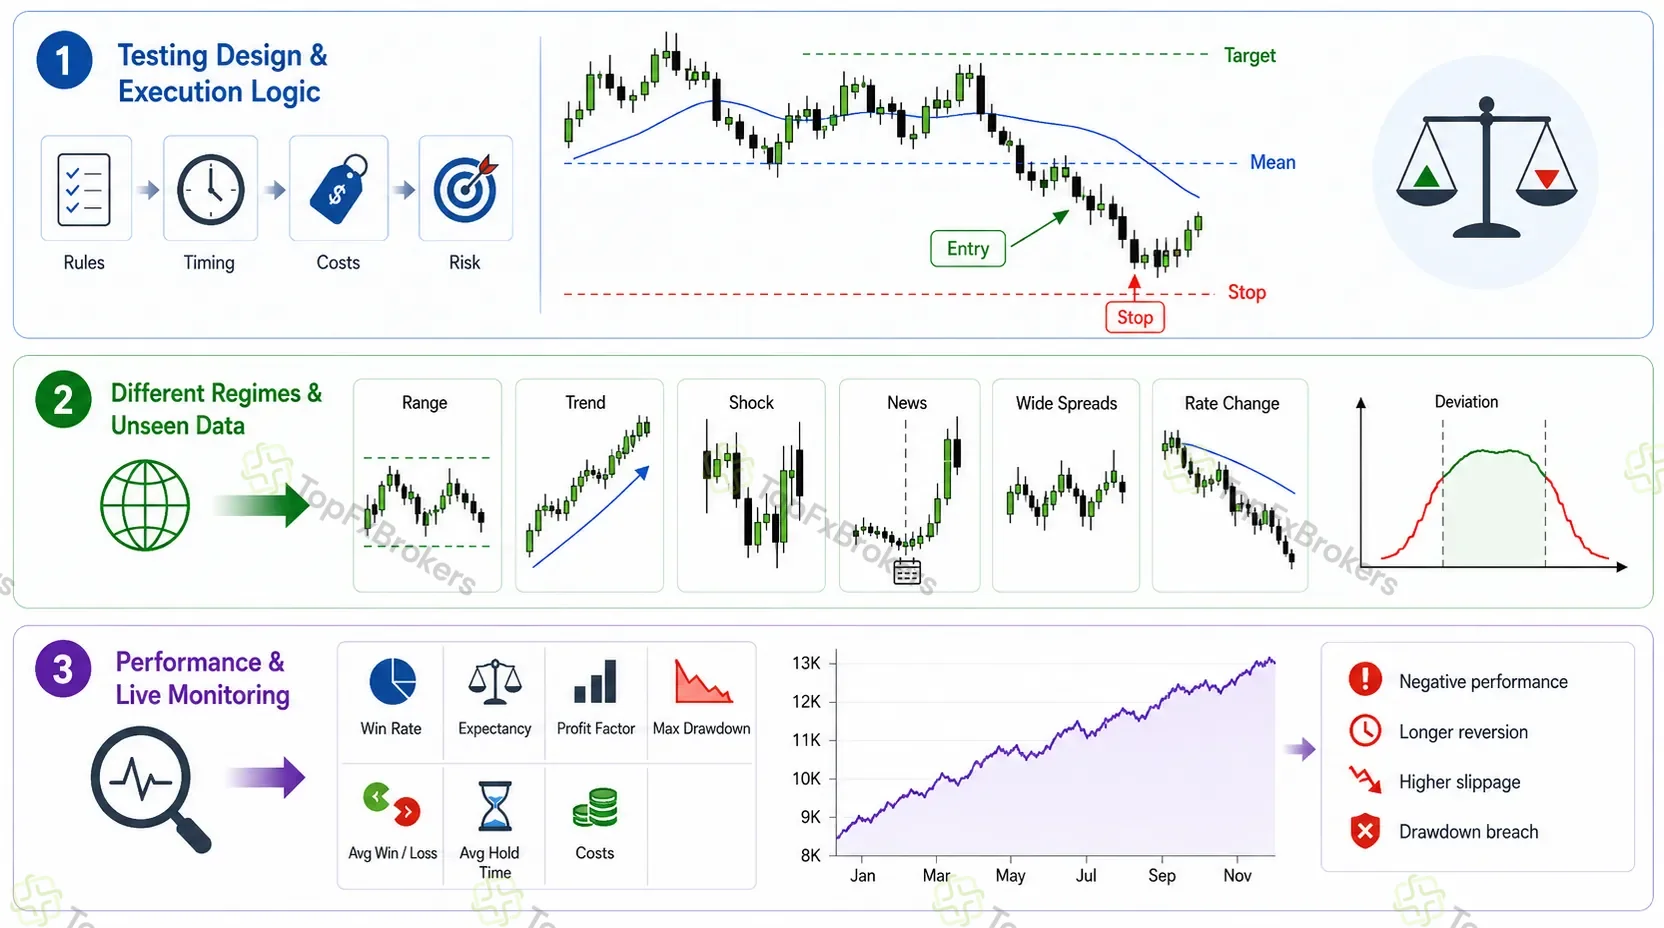
Testing Design and Execution Logic
The test must define the currency pair, data source, timeframe, session, reference mean, required deviation, regime filter, entry method, stop, target, time exit, position sizing, event exclusions, and cost assumptions.
The rules should be specific enough for another researcher to reproduce the test; otherwise, ambiguous decisions can be interpreted favorably after the outcome is known.
Timing also matters. The test must state when the signal becomes available and whether entry occurs at the same close, the next open, or another executable price. Midpoint candles are not tradeable prices: a long position generally enters at the ask and exits at the bid, while a short trade does the reverse.
When one candle contains both the stop and target, lower-timeframe data or a conservative assumption should determine the result. Automatically selecting the favorable sequence overstates performance.
Limit entries need credible fill logic. Touching a quoted level does not guarantee execution, especially when price reverses quickly or liquidity is limited. News and rollover periods should use cost assumptions that reflect those conditions rather than an average spread observed during calm hours.
Different Regimes and Unseen Data
The sample should contain quiet ranges, sustained trends, volatility shocks, major announcements, different interest-rate environments, and periods with unusually wide spreads. A strategy developed during one long consolidation may simply describe that consolidation.
Separate strategy development from final evaluation. One period can establish the logic and reasonable parameter ranges, another can compare a limited number of alternatives, and a final unseen period can assess the locked rules.
The objective is not to discover one perfect setting. Nearby values should produce broadly similar behavior. A narrow performance peak around one exact threshold is less convincing than a stable region of acceptable results.
Performance and Live Monitoring
Win rate alone reveals little. A strategy can win frequently and still lose money when failed trends produce losses much larger than the average gain.
Evaluation should cover trade count, average winner and loser, expectancy, profit factor, maximum drawdown, longest losing sequence, holding time, adverse movement before exit, cost sensitivity, and performance by pair, session, and market regime.
Live behavior should then be compared with the assumptions in the test. Investigation may be necessary when rolling performance turns negative, trades take materially longer to revert, adverse movement increases, slippage exceeds the modeled level, range failures become more frequent, or drawdown breaches the predefined limit.
The system should not be redesigned after every losing trade. At the same time, a documented strategy needs objective conditions for pausing and reviewing whether its original edge still exists.
Do Mean Reversion Strategies Work in Forex?
Mean-reversion strategies can work in forex, but only under clearly defined conditions. Currency pairs do not have a permanent tendency to return to a moving average, range midpoint, or session level. A strategy is credible only when a specific type of deviation has repeatedly contracted within the intended holding period and remained profitable after realistic trading costs.
The result must also remain reasonably stable across different periods and market environments. A return that occurs only after the stop is reached, after the time limit expires, or after an unacceptable drawdown does not validate the trade.
The real test is whether the strategy produces consistent results when its rules, costs, holding period, and market conditions are defined in advance. Mean reversion is useful only when that edge survives outside a few favorable examples and remains strong enough to justify the risk.
Mean Reversion Trading Checklist
- What is the reference mean, and was it selected before the signal appeared?
- Is the mean stable enough to remain a realistic target?
- Has price reverted from comparable deviations in the current regime?
- Is the market rotating within a range rather than establishing a persistent trend?
- Is volatility stable or settling instead of continuing to expand?
- Is a high-impact economic or central-bank event imminent?
- Has price confirmed rejection of the extreme?
- Where is the objective invalidation level, and what is the maximum holding time?
- Is the expected reward sufficient after spread, slippage, and financing?
- Does the trade duplicate currency exposure already held elsewhere in the portfolio?
If several answers remain unclear, the setup is not ready. The checklist is intended to expose dependence on hope, not to make every trade appear perfect.
Conclusion
Successful forex mean reversion depends less on identifying an extreme than on determining whether the market's previous equilibrium still matters.
A strong process selects a suitable pair and timeframe, confirms that the reference remains stable, waits for price to reject the extreme, and defines the stop, target, position size, and time limit before entry.
When price becomes accepted beyond the range, volatility continues expanding, or the mean begins trending away, the old equilibrium should no longer be defended. A disciplined strategy does not rely on price eventually returning. It relies on recognizing when the expectation of reversion is no longer justified.
FAQ
What Is the Best Indicator for Forex Mean Reversion?
What Is the Best Timeframe?
Which Currency Pairs Are Best?
Are RSI and Bollinger Bands Enough?
What Deviation Threshold Should Traders Use?
Can Mean Reversion Work During a Trend?
Can a Mean-Reversion Strategy Be Automated?

Written by:
Asmae Amrani
Asmae contributes broker reviews, educational resources, trading strategy articles, and industry insights for TopFxBrokers. Her work combines detailed research with clear explanations, helping readers compare trading platforms, understand market concepts, and stay informed about the evolving financial landscape.
She is committed to producing accurate, impartial, and well-researched content that empowers traders to make confident, well-informed decisions.