

































Most five-point patterns are labelled X, A, B, C and D. The first four points establish the structure; D is the projected completion area. Some patterns, including the Gartley and Bat, finish inside the original XA range. Others, such as the Butterfly and Crab, extend beyond X. The ABCD, Shark, 5-0 and Three-Drive formations use related logic but do not all follow the same XABCD template.
Risk notice: Trading leveraged financial products involves substantial risk and may not be suitable for everyone. Harmonic patterns can fail even when their measurements are precise. The material below is educational and is not personal trading advice.
Key Takeaways
- Harmonic patterns are measured price structures; accurate swing relationships matter more than a familiar-looking outline.
- Point D identifies a potential reversal zone, not an automatic entry level or a guaranteed reversal.
- A well-defined PRZ combines the pattern’s required completion measurement with supporting projections or structural confluence; the exact components vary by pattern.
- For XABCD patterns, classify the candidate from its B and C measurements before projecting D. Naming or adjusting the pattern after price reverses introduces hindsight bias.
- Consistent pivot-selection rules, fixed ratio tolerances and predefined confirmation criteria are essential for meaningful testing.
- A valid pattern is worth trading only when invalidation is clear, position size is controlled and the realistic reward justifies the risk.
What is Harmonic Trading?
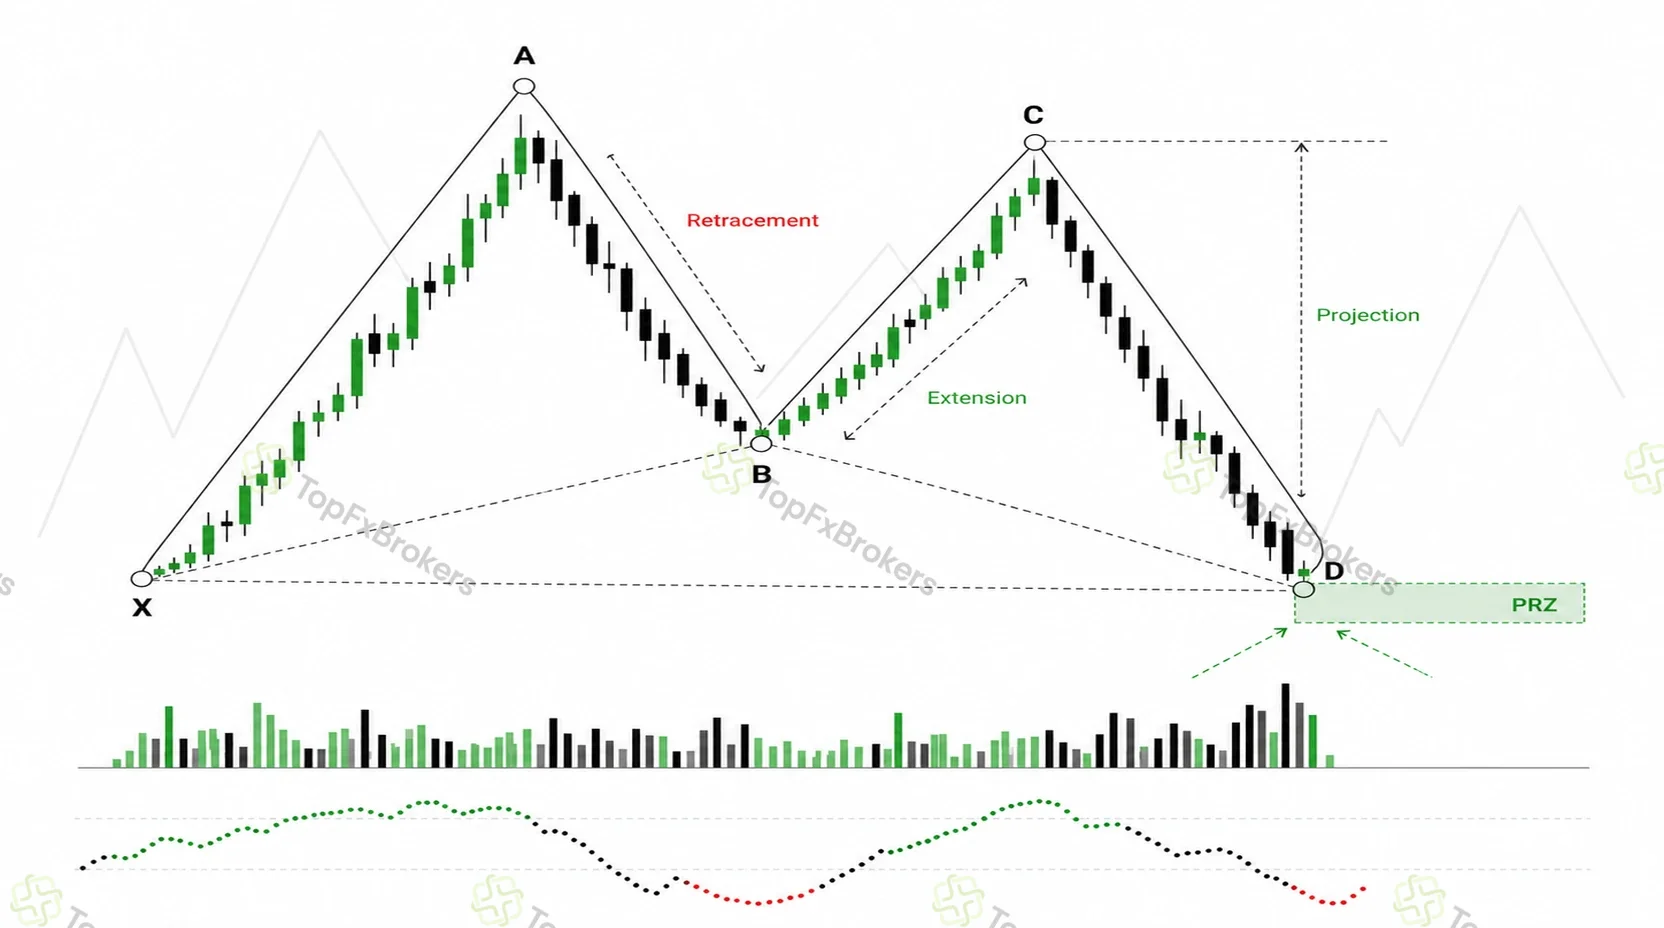
Harmonic trading organizes price movement into proportional waves. A retracement compares a corrective leg with the move that preceded it. An extension measures how far a later leg travels beyond an earlier swing. A projection compares the length of one leg with another. When those independent calculations point to a narrow area, they form a PRZ.
The modern ratio-based framework is associated largely with Scott Carney, who formalized Fibonacci requirements for the Gartley and developed patterns including the Bat, Crab, Deep Crab, Shark and 5-0. H. M. Gartley had described the underlying five-point formation in 1935, but the now-familiar 0.618 B point and 0.786 D point were assigned later. The Butterfly’s general extension structure is associated with Bryce Gilmore, while Carney defined the ratio alignment used in his harmonic methodology.
Ratio tables conflict because authors and indicators use different labels, ranges and tolerances. State the definition being tested; combining the B-point rule from one method with the D-point rule from another produces an inconsistent pattern.
Unlike shape-based chart recognition, harmonic analysis treats the outline as a starting clue rather than the deciding evidence. The measured relationships determine whether the structure qualifies. A formation resembling a Bat is not a Bat when B retraces too deeply or when the projected D level fails to converge with the required BC and AB=CD calculations.
How Fibonacci and Harmonic Ratios Work
The ratios used in harmonic trading include direct Fibonacci relationships and additional derived measurements adopted by harmonic methodologies. For that reason, “Fibonacci and harmonic ratios” is more accurate than calling every level a Fibonacci number. The 0.50 retracement, for example, is widely used in market analysis but is not a ratio produced directly by the Fibonacci sequence.
Retracements, Extensions and Projections
Suppose price rises from X to A. If the subsequent AB decline gives back 61.8% of XA, B is a 0.618 retracement. If a later decline passes below X and reaches 127.2% of XA, it is a 1.272 extension. A projection works from a different leg: the length of BC may be multiplied by 1.618 or 2.618 and projected from C to estimate D.
No individual level validates a pattern. A 0.886 XA retracement might be part of a Bat, but it becomes useful only when the B point, BC projection and AB=CD relationship support the same completion area. The cluster is the analytical object; the isolated ratio is only one input.
| Measurement | Common levels | How it is used |
|---|---|---|
| Shallow retracements | 0.382, 0.50 | Often define B in a Bat or C in several XABCD patterns. |
| Core retracements | 0.618, 0.786 | Used for defining points such as Gartley B and D, Butterfly B, and Cypher D. |
| Deep retracement | 0.886 | Defines the Bat D point, Deep Crab B point and an important Shark completion relationship. |
| Moderate extensions | 1.13, 1.272, 1.414, 1.618 | Project legs beyond a prior swing or define alternate AB=CD relationships. |
| Extended projections | 2.0, 2.24, 2.618 | Frequently measure BC in Butterfly, Bat, Crab and Deep Crab structures. |
| Extreme projections | 3.14, 3.618 | Used mainly in extreme BC projections for Crab-family patterns. |
The XABCD Structure
X and A define the initial impulse. B retraces XA and is usually the most efficient clue to the pattern family. C then retraces AB, while D completes the structure through a retracement or extension of XA and supporting projections. In a bullish pattern, D forms after the final decline; in a bearish pattern, it forms after the final advance.
The labels should mark meaningful pivots, not convenient candle extremes selected to improve the ratios. If adjacent swings compete for the same label, define a pivot rule before continuing. That rule might use a fixed zigzag depth, an average-true-range threshold or a consistent number of candles on each side of a pivot. The exact method is less important than applying it without changing the anchors after the result is visible.
Ratio Tolerance and Pattern Quality
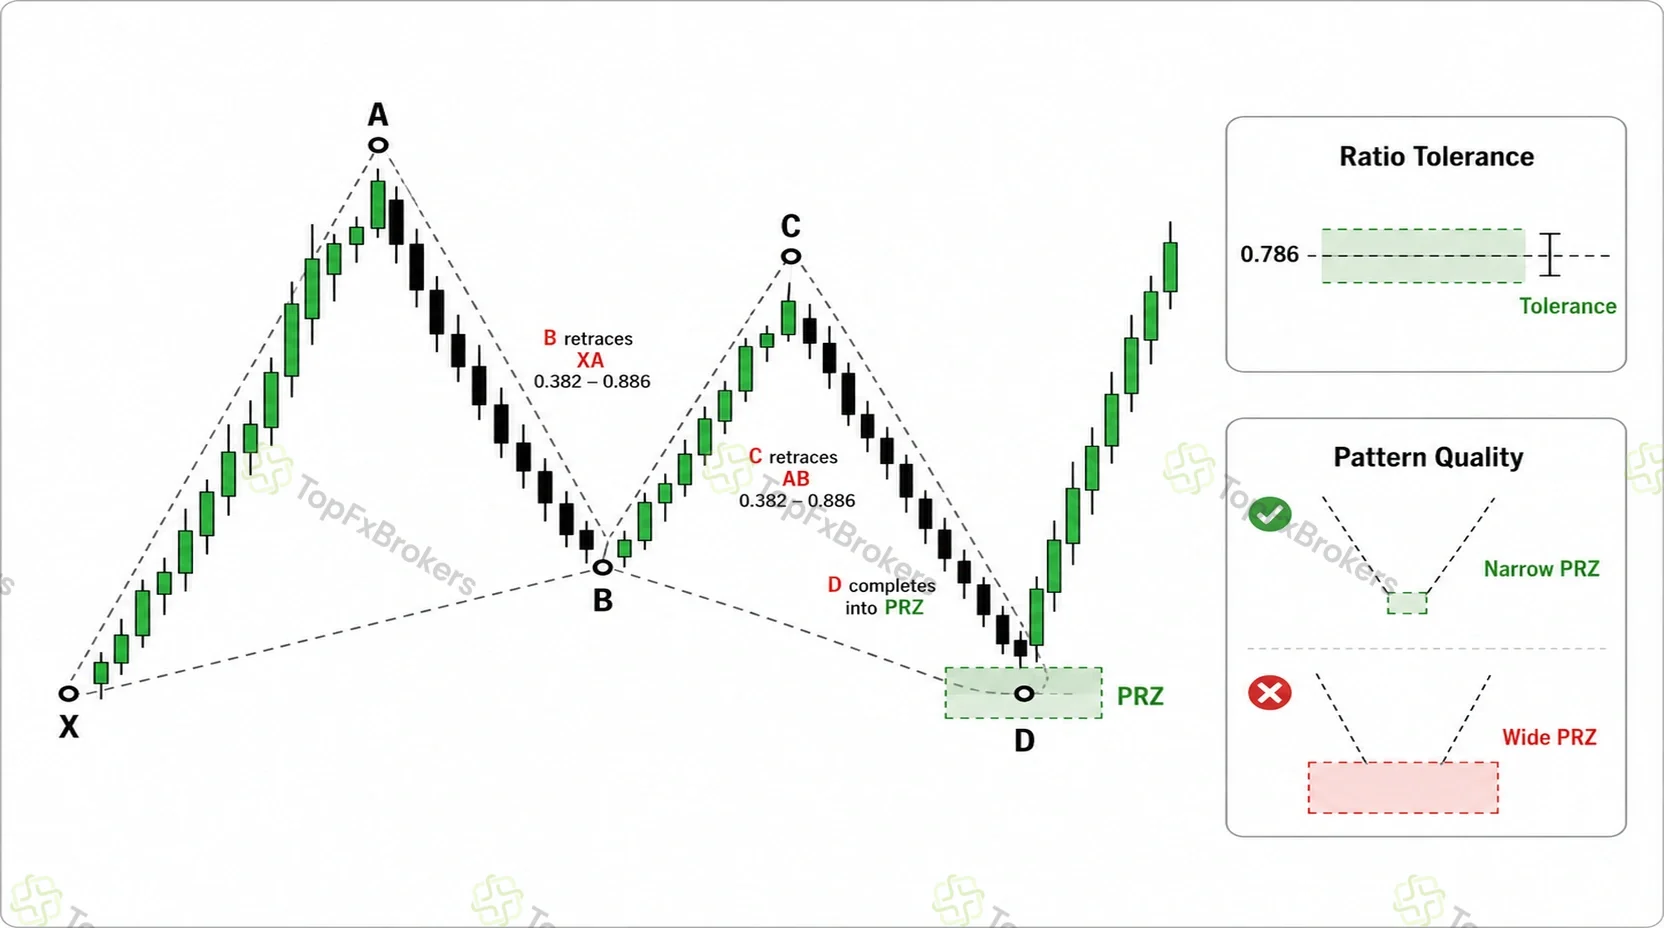
Markets rarely print every ideal ratio to the final decimal. Some tolerance is therefore practical, but there is no universal allowance that makes a pattern valid. A strict methodology may permit only a few percentage points around a defining ratio; a scanner may use a wider range to avoid missing candidates. Wider settings create more signals and more overlap between pattern families.
Choose the tolerance before testing and apply it to the measured relationship, not arbitrarily to the chart price. For example, a relative tolerance of plus or minus 3% around 0.786 produces an acceptable ratio range of roughly 0.762 to 0.810. Do not use a narrow tolerance for winning examples and a broad tolerance for losing ones. The same rule must apply to every sample.
Pattern quality is not binary. Clean pivots, close convergence, a compact PRZ and balanced timing improve interpretability; overlap, late redrawing, a wide zone or unusually forceful completion weaken it.
The Potential Reversal Zone
The PRZ is the price band where the pattern is expected to complete. It is built by calculating the defining XA or XC retracement or extension, the relevant BC projection and an AB=CD completion. The measurements rarely land on one exact price, so the highest and lowest credible levels form a zone.
A useful PRZ is narrow enough to support a practical invalidation level. If the components are scattered across a large range, the trader faces an awkward choice: enter early with incomplete confluence, wait until the pattern is nearly invalid, or use a stop so wide that the reward no longer compensates for the risk. In that situation, rejecting the setup is usually more disciplined than averaging the levels into a false point of precision.
How price reaches the zone matters as much as where the zone sits. Smaller candles, failed continuation, repeated rejection and a shift in local structure suggest that the order flow is changing. Large directional candles closing through every component of the PRZ suggest the opposite. Point D tells the trader where to become attentive; the reaction determines whether there is a trade.
Harmonic Pattern Guide
The following sections use a consistent ratio-based framework while highlighting where definitions vary. Ratios describe the magnitude of one price leg relative to another. Bullish and bearish versions use the same measurements in opposite directions.
ABCD Pattern
The ABCD is the foundation of harmonic analysis because it reduces the idea to two directional legs separated by a correction. Price moves from A to B, retraces to C, then travels from C to D. In the ideal version, CD equals AB in price length. The time taken by the two legs may also be similar, although price symmetry is the primary measurement.
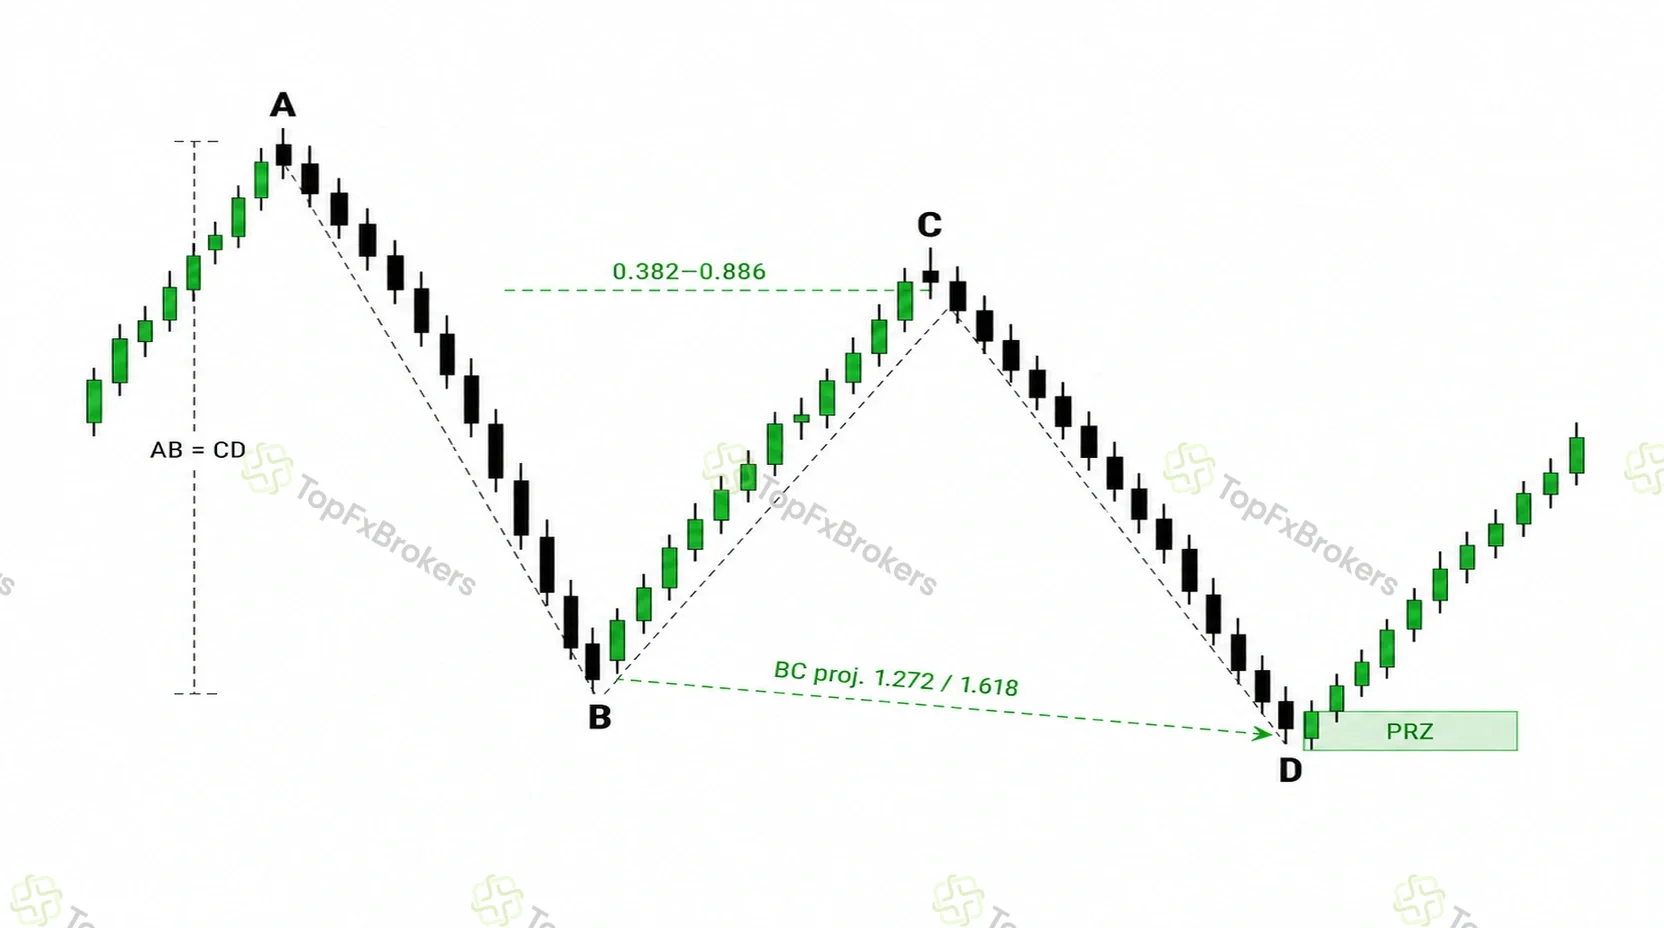
C should retrace at least 0.382 and no more than 0.886 of AB. That retracement determines the reciprocal BC projection. A 0.618 retracement commonly points to a 1.618 BC projection, while a 0.786 retracement corresponds more closely with a 1.272 projection. The PRZ forms where the projected AB=CD completion and the appropriate BC extension converge.
An equivalent AB=CD is the minimum reference, not a command to enter. Some formations extend CD to 1.272 or 1.618 of AB; these are alternate AB=CD structures and should be labelled separately in a journal. A much faster or longer CD leg may indicate acceleration rather than exhaustion, particularly when it reaches D without pausing.
Gartley Pattern
The Gartley is a retracement pattern that completes inside the original XA range. Its defining midpoint is B at approximately 0.618 of XA. C then retraces 0.382 to 0.886 of AB, and D is projected near the 0.786 retracement of XA. Because D remains on the X side of B but does not pass X, the structure resembles a deep correction rather than an external breakout.
The 0.786 XA level is only the center of the calculation. A valid PRZ should also contain an AB=CD relationship and a BC projection, commonly within roughly 1.13 to 1.618 of BC. In many well-proportioned examples, an equivalent AB=CD converges close to the XA retracement. A 1.272 alternate AB=CD can appear, but it should not be used to rescue a structure with an incorrect B point.
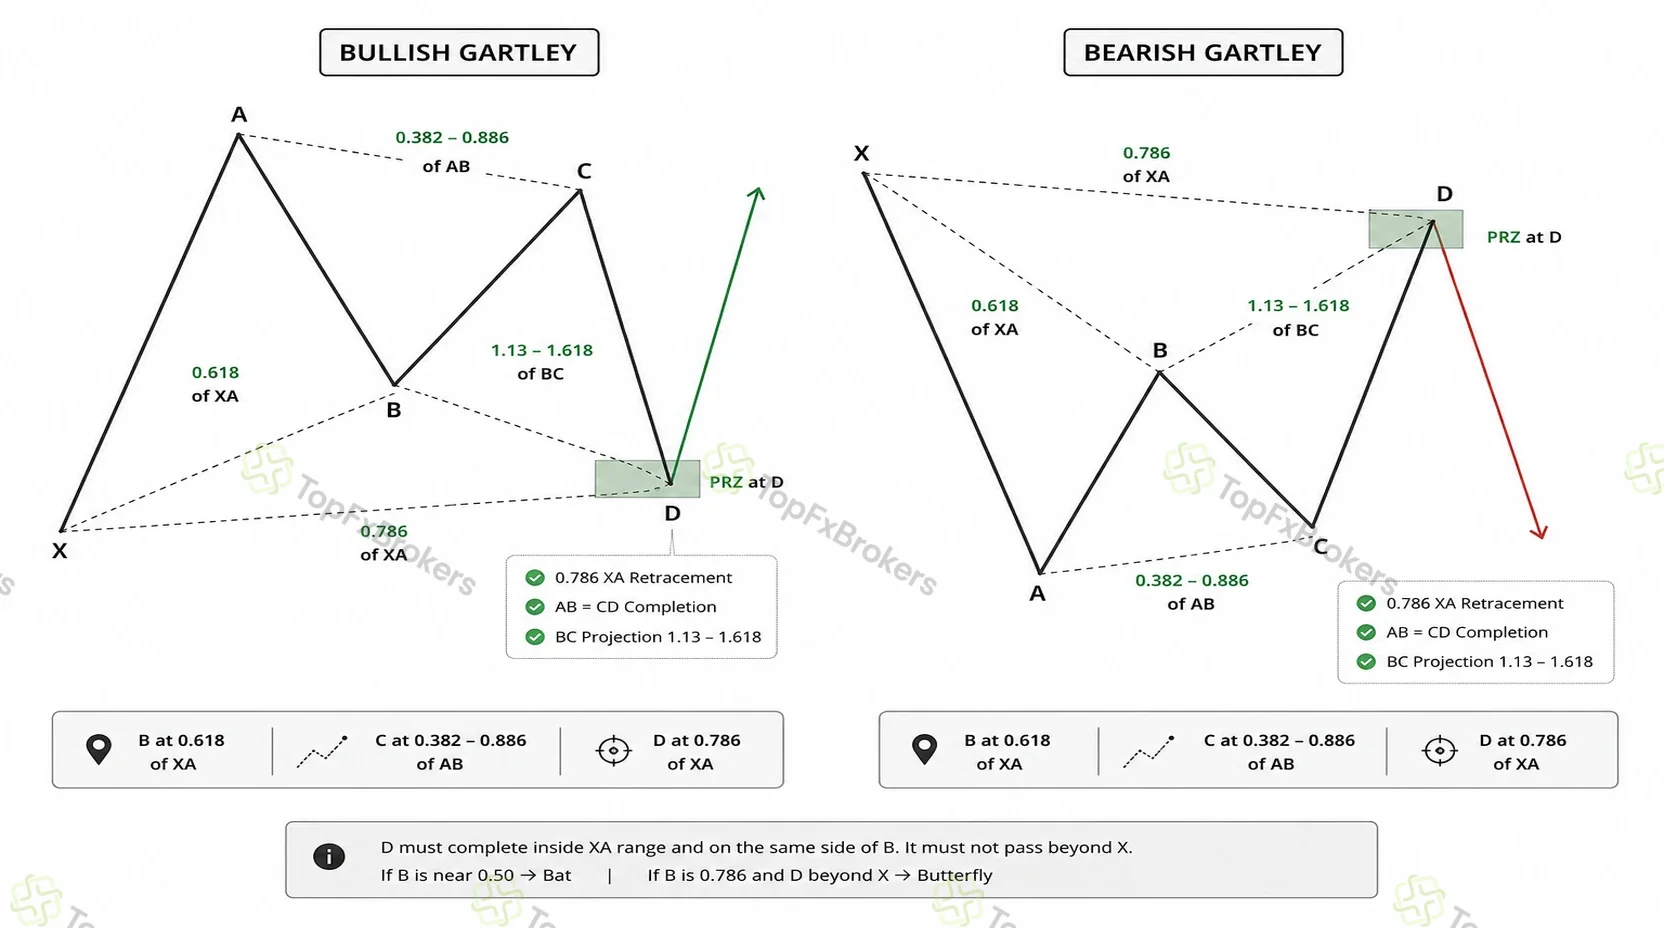
B separates the Gartley from nearby alternatives. If B is closer to 0.50, the structure is more consistent with a Bat. If B is 0.786 and D is projected beyond X, the structure points toward a Butterfly. A Gartley that requires B to be called both 0.50 and 0.618 depending on the selected candle is too ambiguous to test reliably.
Bat Pattern
The Bat is also an internal retracement pattern, but it starts with a shallower B point and finishes deeper in the XA leg. B is preferably near 0.382 or 0.50 of XA and must remain below 0.618 in the standard definition. D completes at the 0.886 retracement of XA, placing the reversal zone close to X without requiring price to break it.
Its supporting measurements are more extended than those of a Gartley. BC should project at least 1.618 and can reach 2.0 or 2.618. The AB=CD component must at least complete; a 1.272 alternate AB=CD is especially common. A strong Bat PRZ therefore combines the 0.886 XA retracement, an extended CD leg and a BC projection in a compact band.
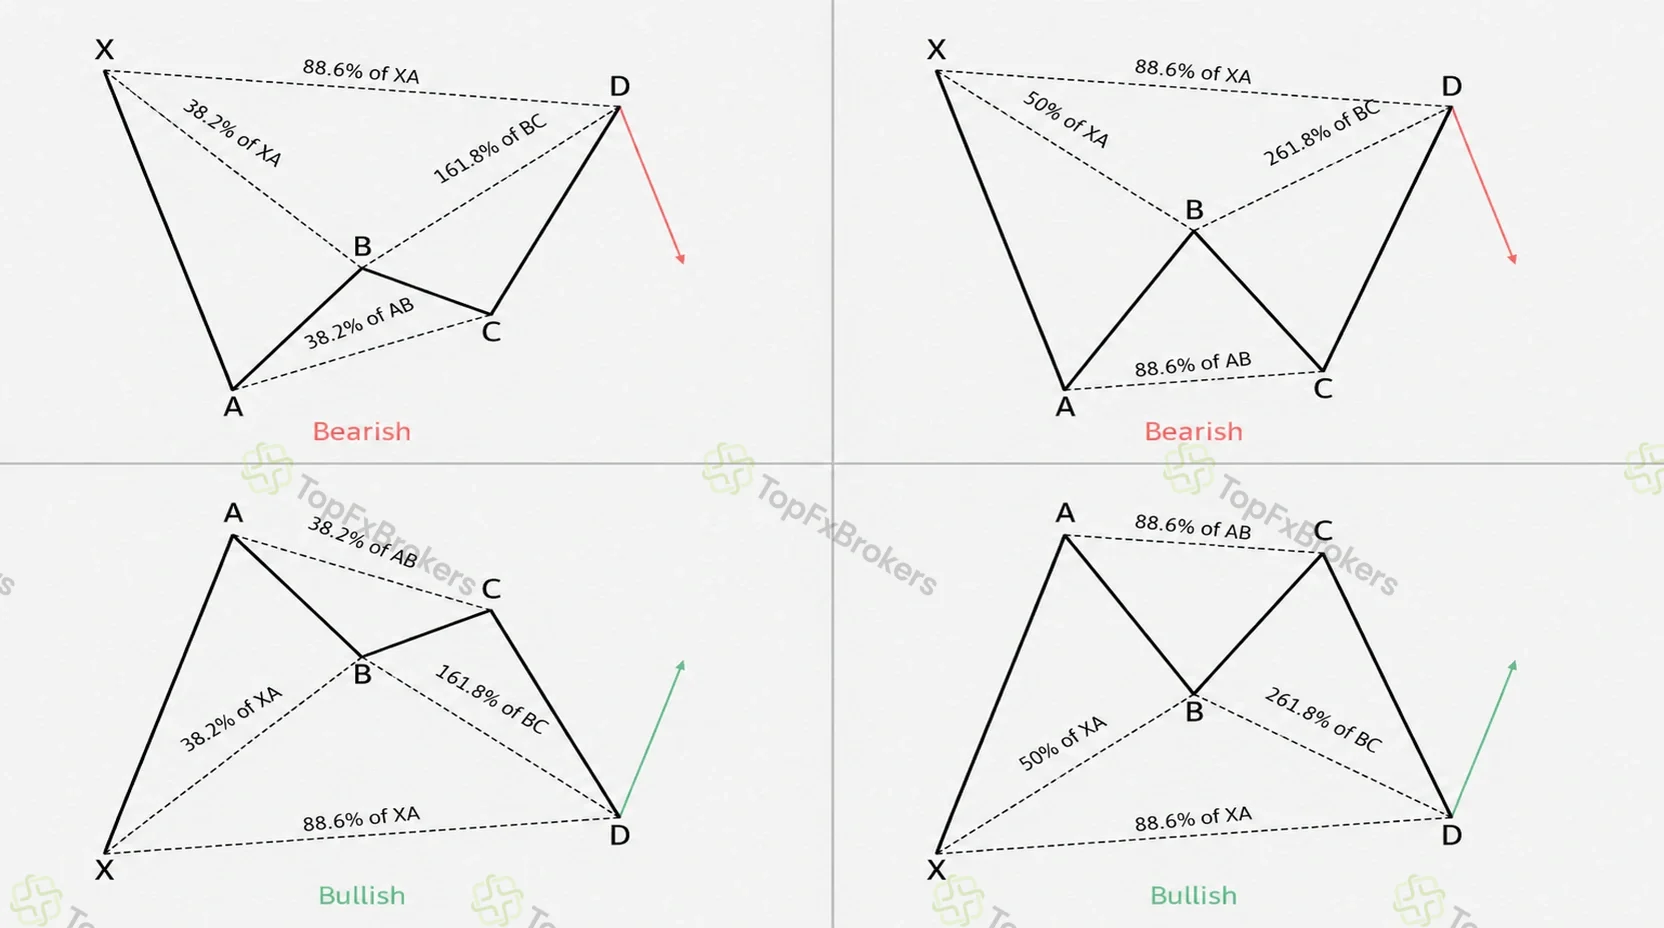
The pattern can feel uncomfortable in real time because price has already travelled through most of XA by the time D forms. That is precisely why the location of X matters. A stop placed just inside the normal noise around X is vulnerable, but allowing unlimited space beyond X destroys the pattern’s risk advantage. The stop method should be tied to the tested definition: beyond the PRZ, beyond X, or beyond a confirmation swing.
Alternate Bat Pattern
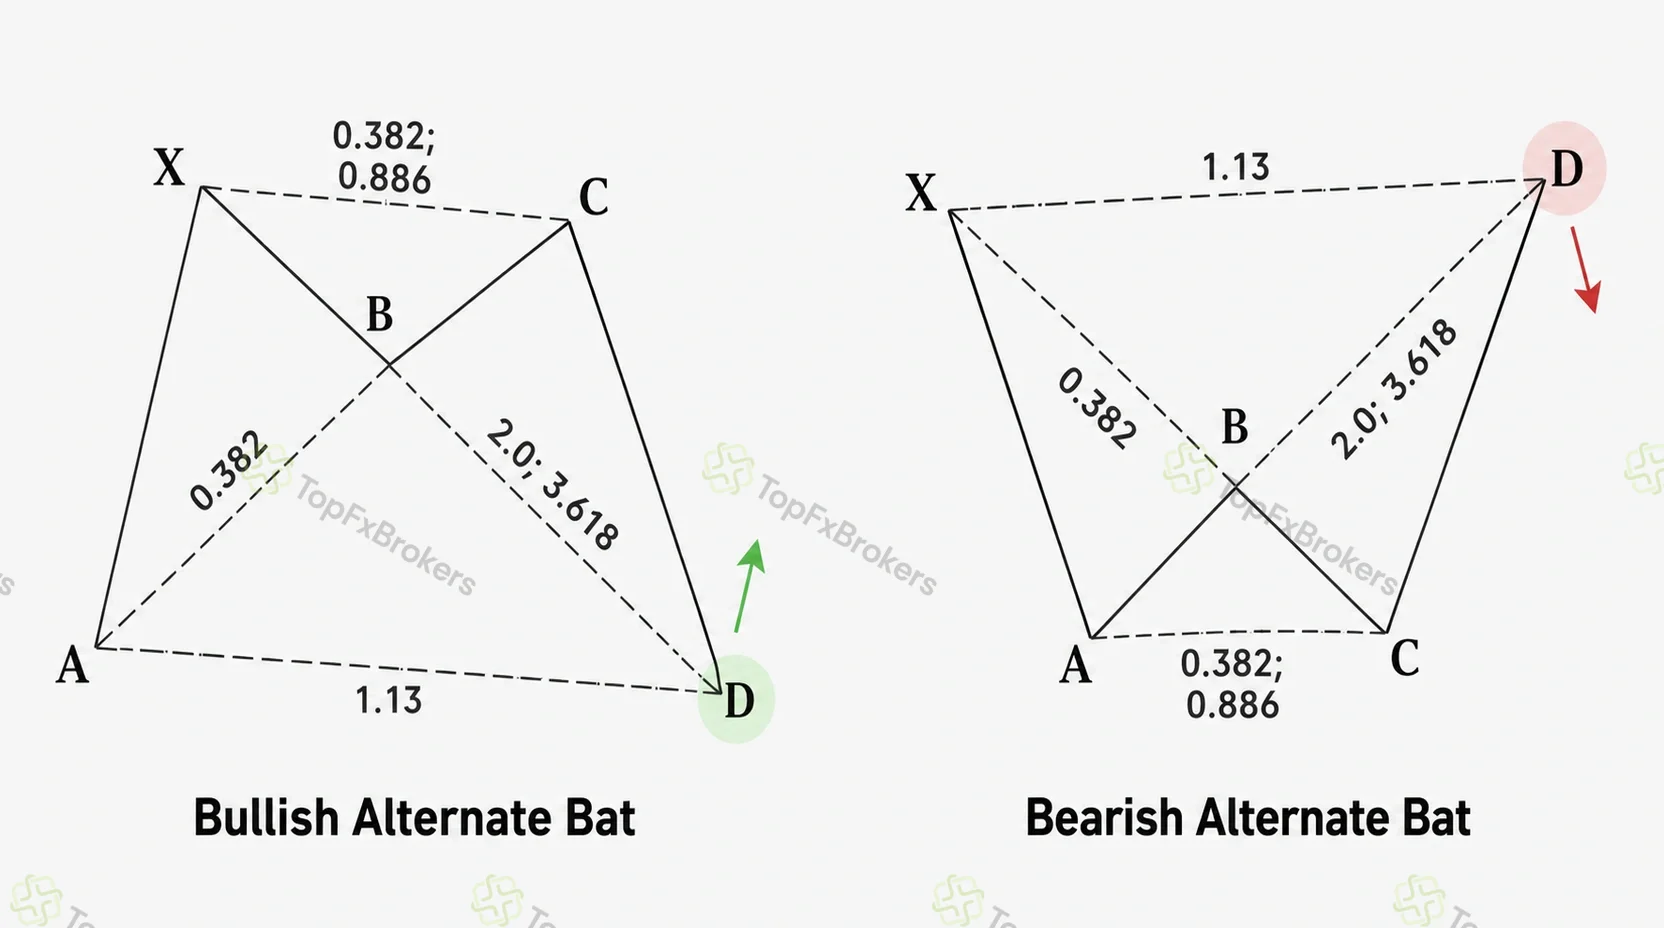
The Alternate Bat applies when the B point is exceptionally shallow, at 0.382 of XA or less. That early relationship separates it from the standard Bat before D forms. C usually retraces 0.382 to 0.886 of AB, while the BC projection should reach at least 2.0. The AB=CD component is always extended and commonly approaches 1.618.
Instead of completing at the standard Bat’s 0.886 XA retracement, D is projected slightly beyond X at the 1.13 extension of XA. The PRZ therefore combines 1.13 XA, the extended AB=CD calculation and the BC projection. This label must be assigned prospectively. A standard Bat that fails at 0.886 cannot be renamed an Alternate Bat unless the shallow B point and external 1.13 completion were already part of the original plan.
Butterfly Pattern
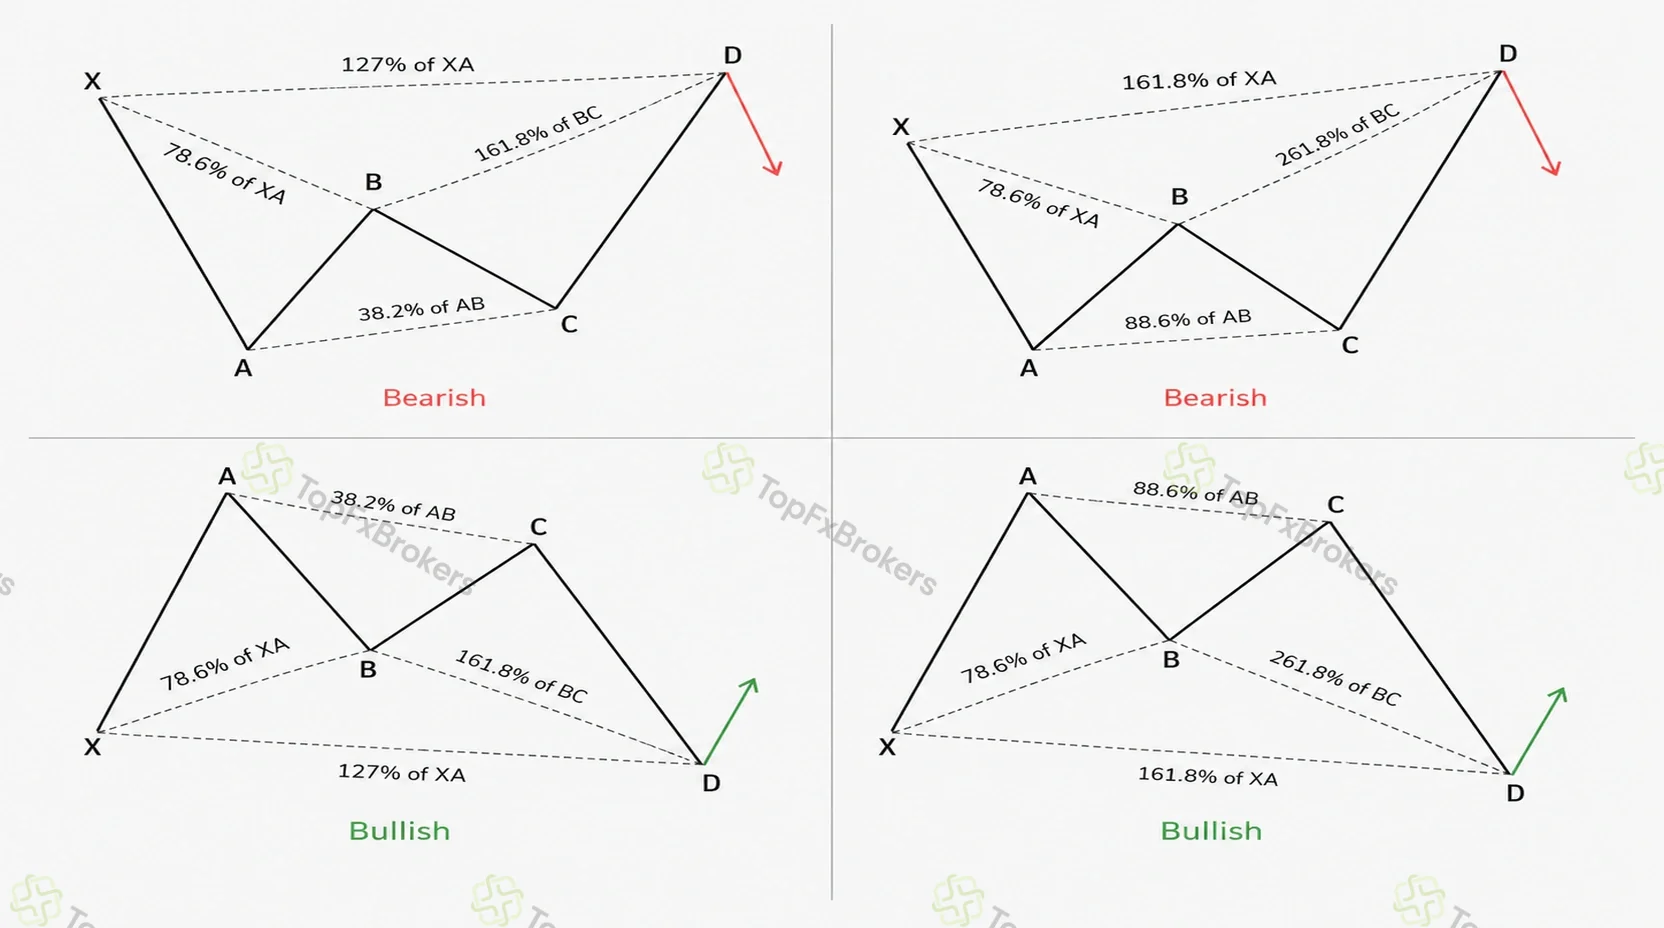
The Butterfly is an extension structure: D forms beyond X, creating the appearance of a breakout or breakdown before the anticipated reversal. The pattern begins with a precise B point near 0.786 of XA. C retraces 0.382 to 0.886 of AB, and the ideal D completion is the 1.272 extension of XA.
The remaining calculations should reinforce that external completion. The BC leg often projects between 1.618 and 2.618, with 2.0, 2.24 and 2.618 particularly relevant in more extended examples. An equivalent AB=CD is a minimum condition; a 1.272 alternate AB=CD is common, while a 1.618 extension represents a more aggressive variation. The ideal 1.272 XA measurement should remain the primary reference so the Butterfly is not blurred into the Crab.
A Butterfly often forms at an obvious prior extreme, which can attract breakout orders as D pushes through X. That feature creates both opportunity and risk. A quick rejection back inside the old range supports the reversal idea. Acceptance beyond X, repeated closes outside the PRZ or continued expansion in candle range suggests that the apparent false break may be genuine.
Crab Pattern
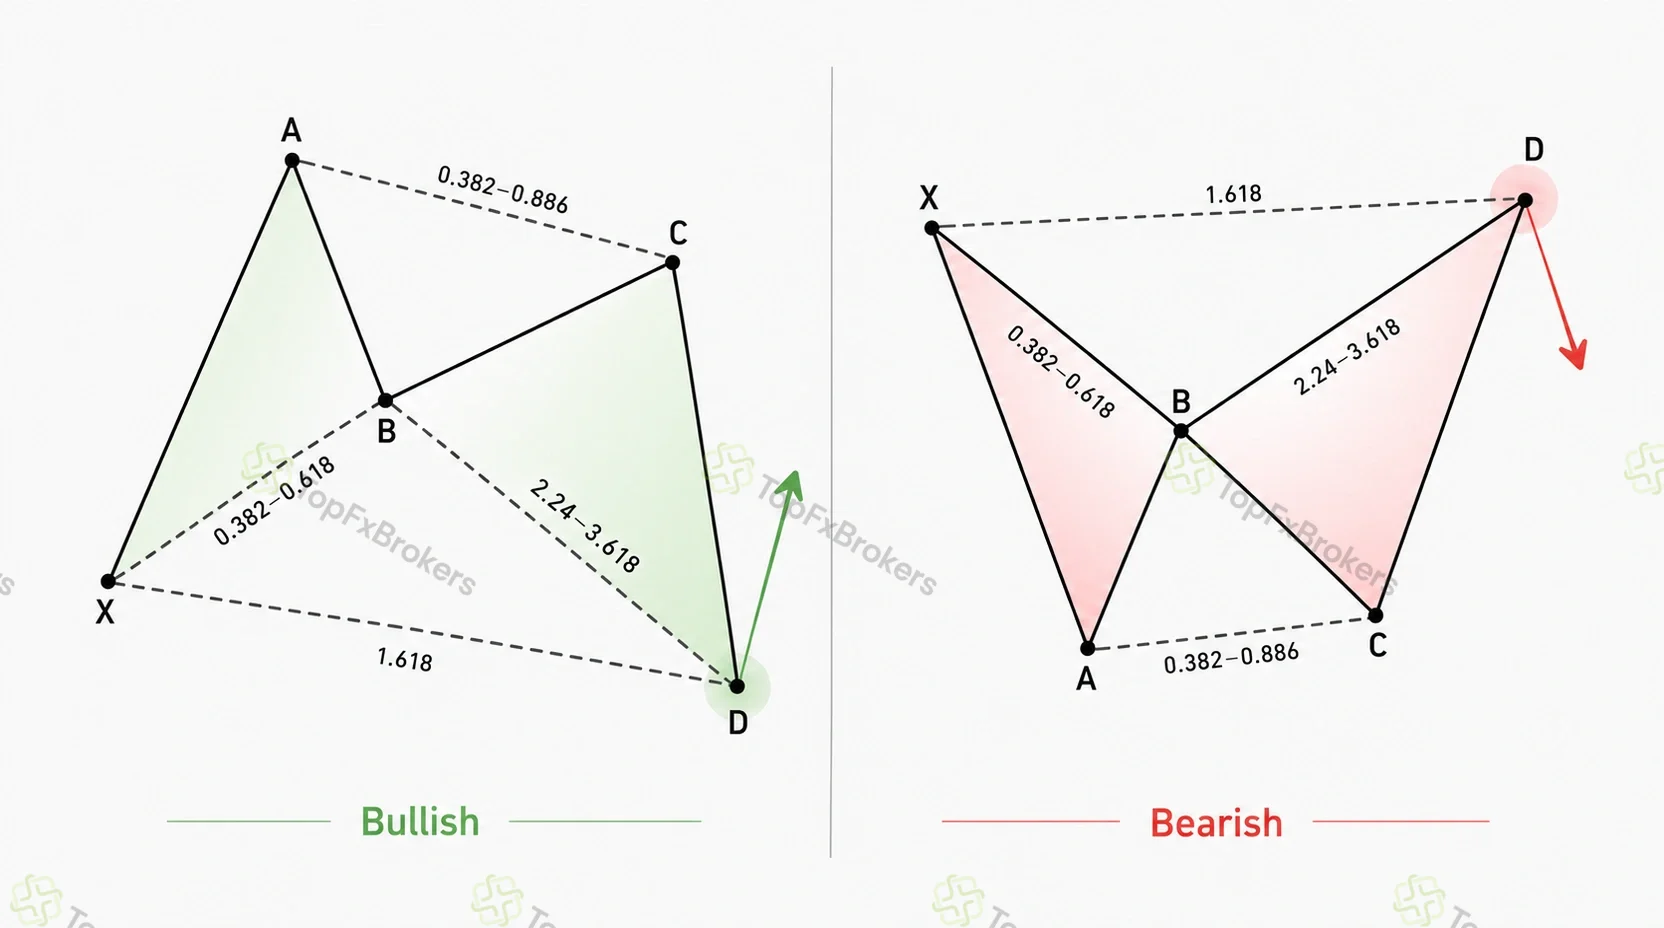
The Crab is the most extreme of the standard five-point extension patterns. B retraces approximately 0.382 to 0.618 of XA, C retraces 0.382 to 0.886 of AB, and D is anchored by the 1.618 extension of XA. The final leg frequently accelerates beyond X, so the PRZ can be tested with sharp candles and elevated volatility.
Extreme BC projections are a defining feature. Depending on the depth of C, the calculation may reach 2.24, 2.618, 3.14 or 3.618. An AB=CD completion should be present, although the alternate 1.272 or 1.618 versions are more common than a perfectly equivalent leg. In the Crab, the 1.618 XA extension and extreme BC projection carry more weight than the AB=CD measurement when the components do not align perfectly.
The regular Crab’s B point prevents confusion with the Deep Crab. B should not sit near 0.886. It also differs from the Butterfly because the Crab’s defining D level is 1.618 XA rather than the ideal Butterfly’s 1.272. Treating the whole 1.272-to-1.618 region as one broad completion range removes the distinction between the patterns and creates an impractically wide PRZ.
Shark Pattern
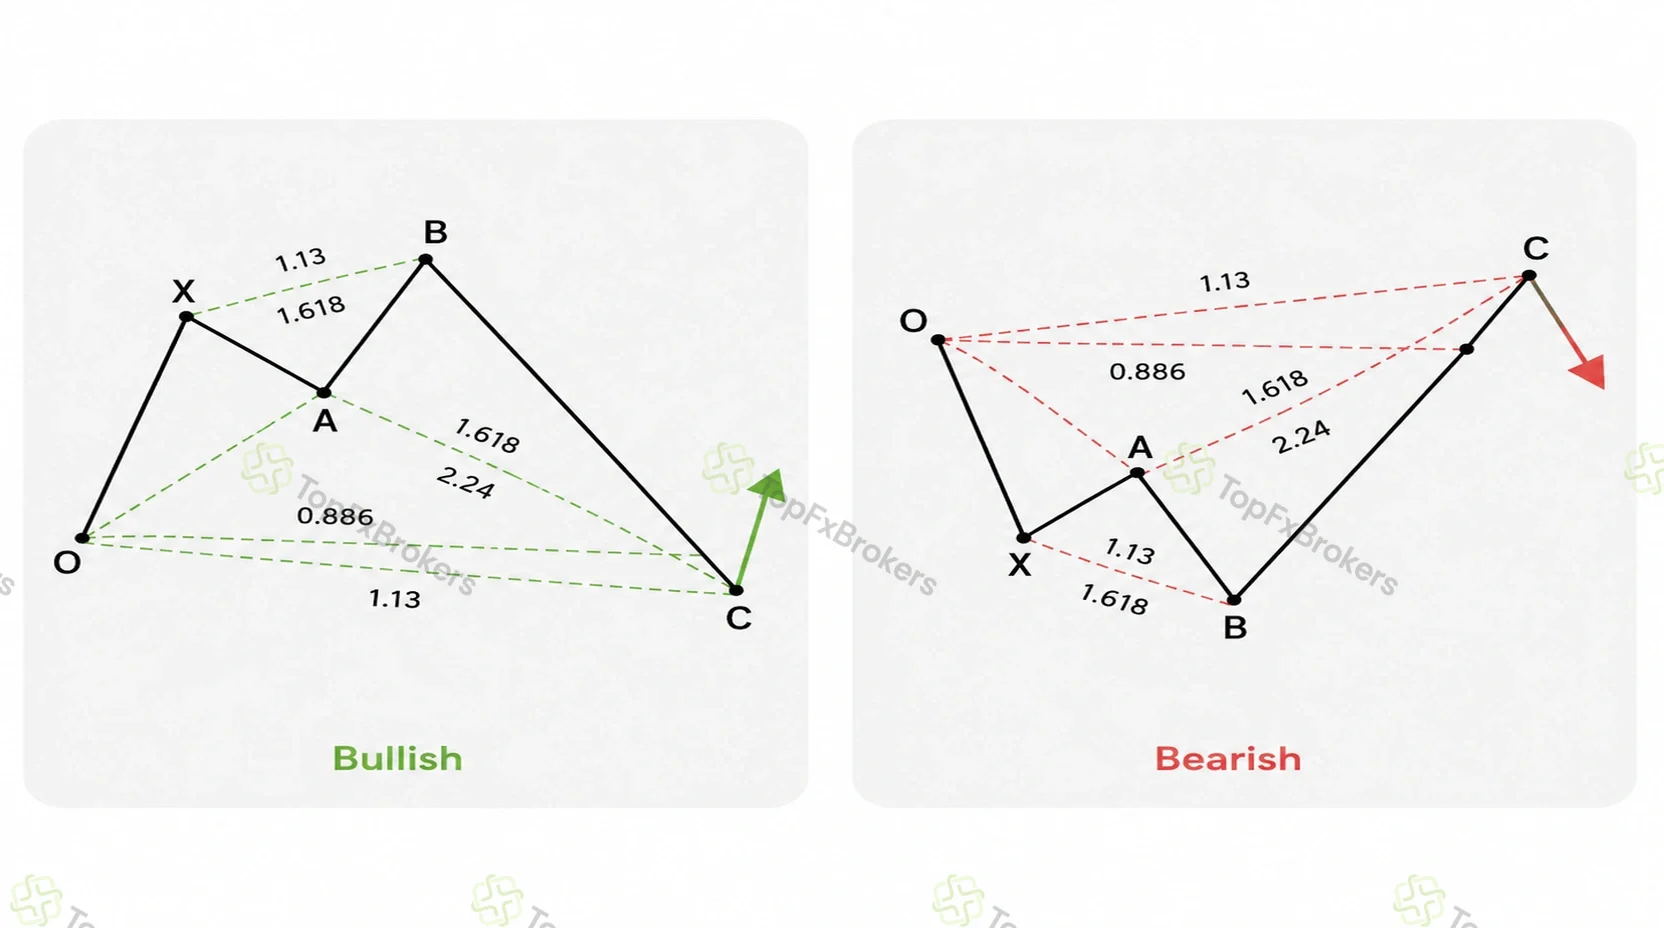
The Shark does not use the conventional XABCD M- or W-shape. It is commonly labelled O, X, A, B and C and represents an extreme impulse followed by a retest of prior support or resistance. The pattern is often treated as the structure that can precede a 5-0 formation.
Its completion logic centers on the 0.886 retracement and the reciprocal 1.13 extension of the OX leg. The impulse into C must also be meaningfully extended; in Carney’s framework, the extreme harmonic impulse component uses a minimum 1.618 relationship. Because notation differs among platforms, the ratios displayed by an indicator should be checked against the exact OX and impulse legs rather than assumed to match an XABCD scanner.
The Shark is designed to capture a counter-trend reaction from an extreme, not necessarily the start of a lasting reversal. It therefore demands active management. A valid completion should produce an immediate change in price character. If price remains beyond the zone or continues to expand without rejection, the premise is weakened quickly.
Cypher Pattern
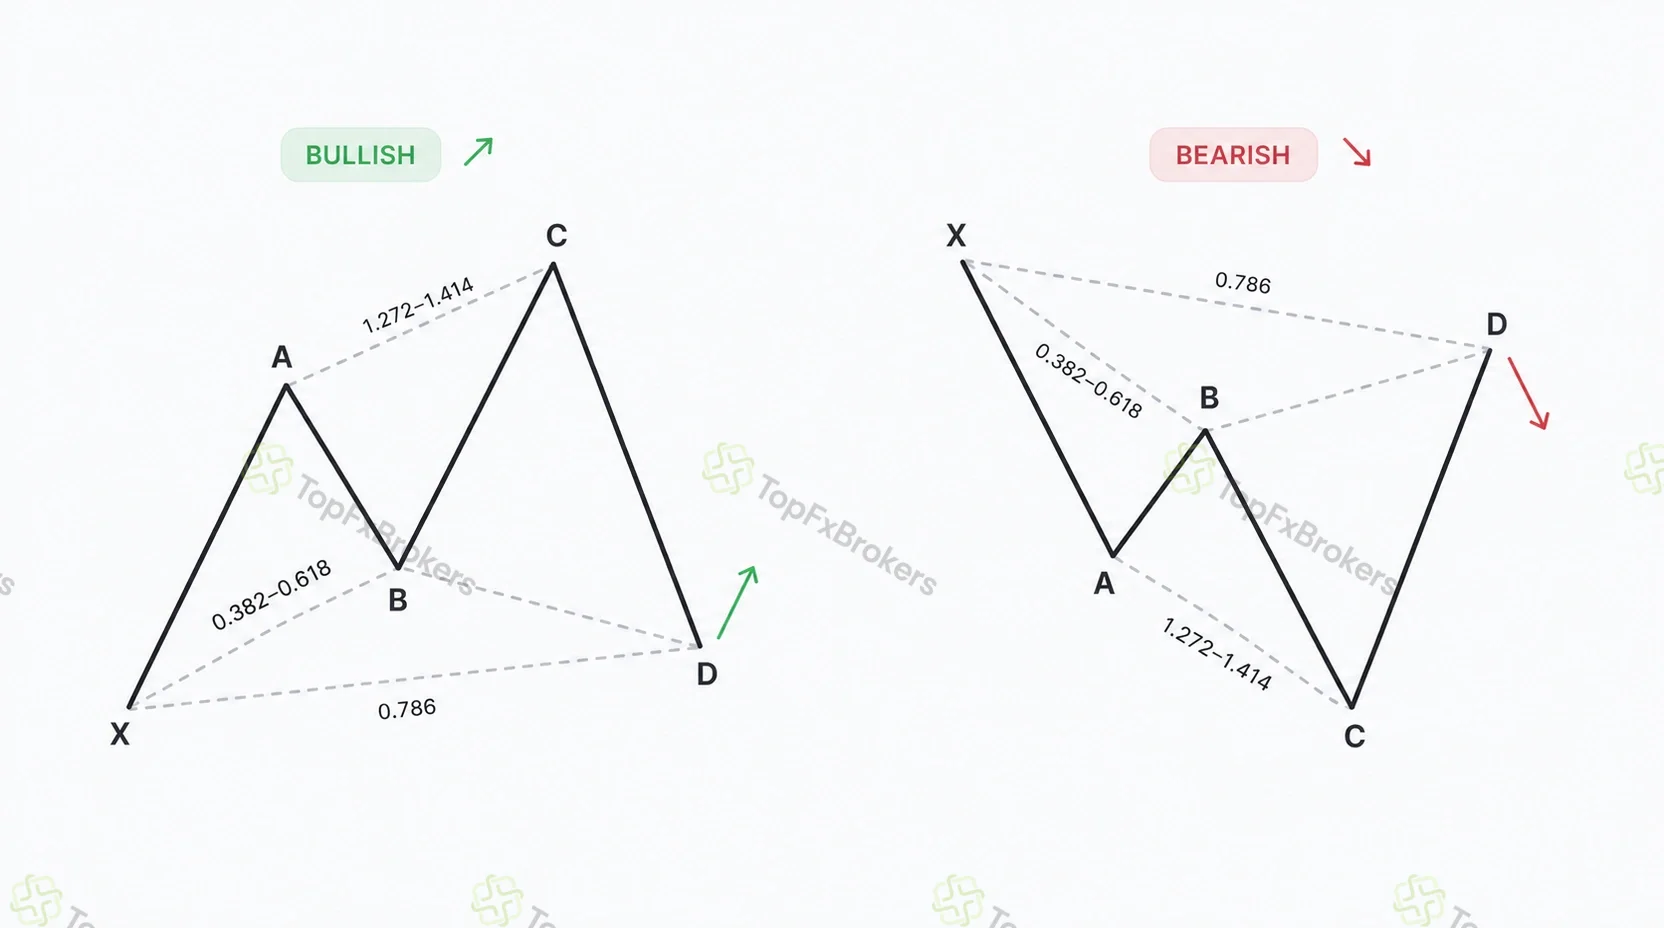
The Cypher is a separate modern harmonic formation rather than part of Carney’s original proprietary pattern set. It uses X, A, B, C and D, but C extends beyond A before D retraces the larger XC move. That sequence gives the pattern a distinctive shape and places the completion back inside the structure.
A strict working definition places B between 0.382 and 0.618 of XA. C then extends approximately 1.272 to 1.414 of XA and must pass A. D completes at the 0.786 retracement of XC. The 0.786 XC level is the principal PRZ component, so the Cypher usually has less ratio clustering than a Gartley or Bat.
The simplicity of the D measurement increases the importance of the earlier points. A C point that does not extend beyond A, or closes materially past the chosen 1.414 limit, changes the structure. Wider definitions sometimes allow B below 0.886, but mixing that looser rule with a strict C range makes comparisons unreliable. Choose one version and label it in the test plan.
5-0 Pattern
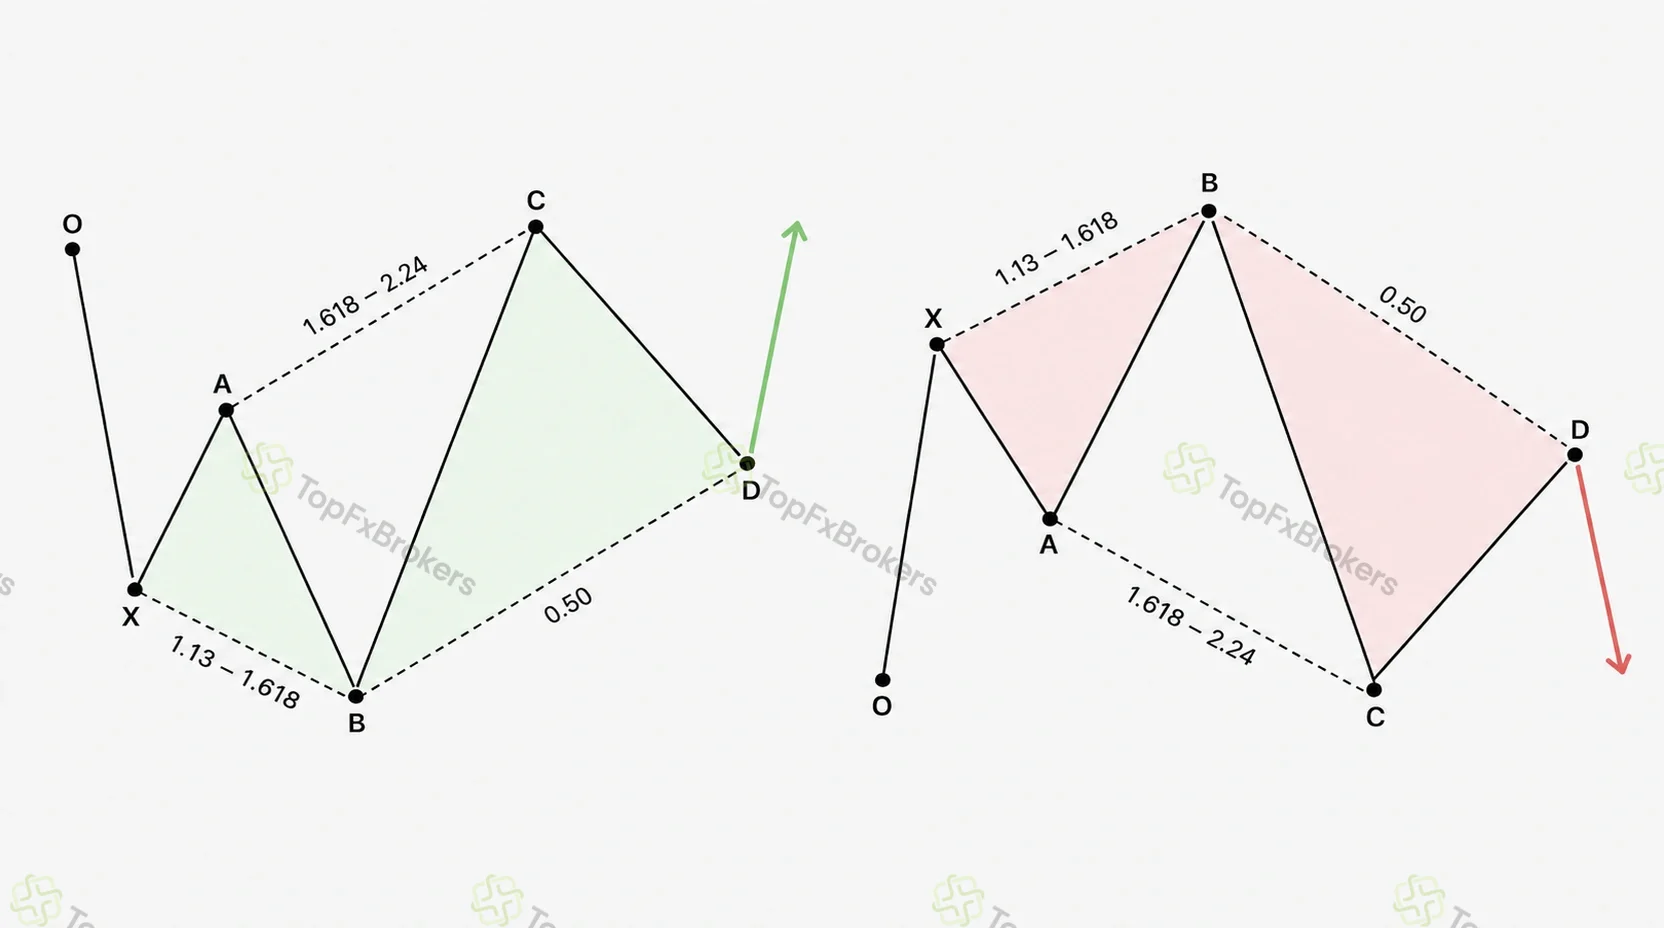
The 5-0 is a reaction pattern that commonly appears after an extended move has begun to reverse. Its construction differs from the familiar Gartley family: the early legs form an impulse and failure sequence, the BC leg becomes the longest leg, and D is a retracement rather than an external extension.
The projection that defines B should not exceed 1.618 of XA. BC must then extend at least 1.618 but not more than 2.24 of AB. Once C is established, D is measured at the 0.50 retracement of BC. A reciprocal AB=CD projection from C should converge with that 50% level to form the PRZ.
This pattern is often interpreted as the first meaningful pullback after a new trend has emerged. That context distinguishes it from a generic 50% retracement. Without the extended BC leg and reciprocal AB=CD structure, the midpoint of BC is simply another retracement level.
Three-Drive Pattern
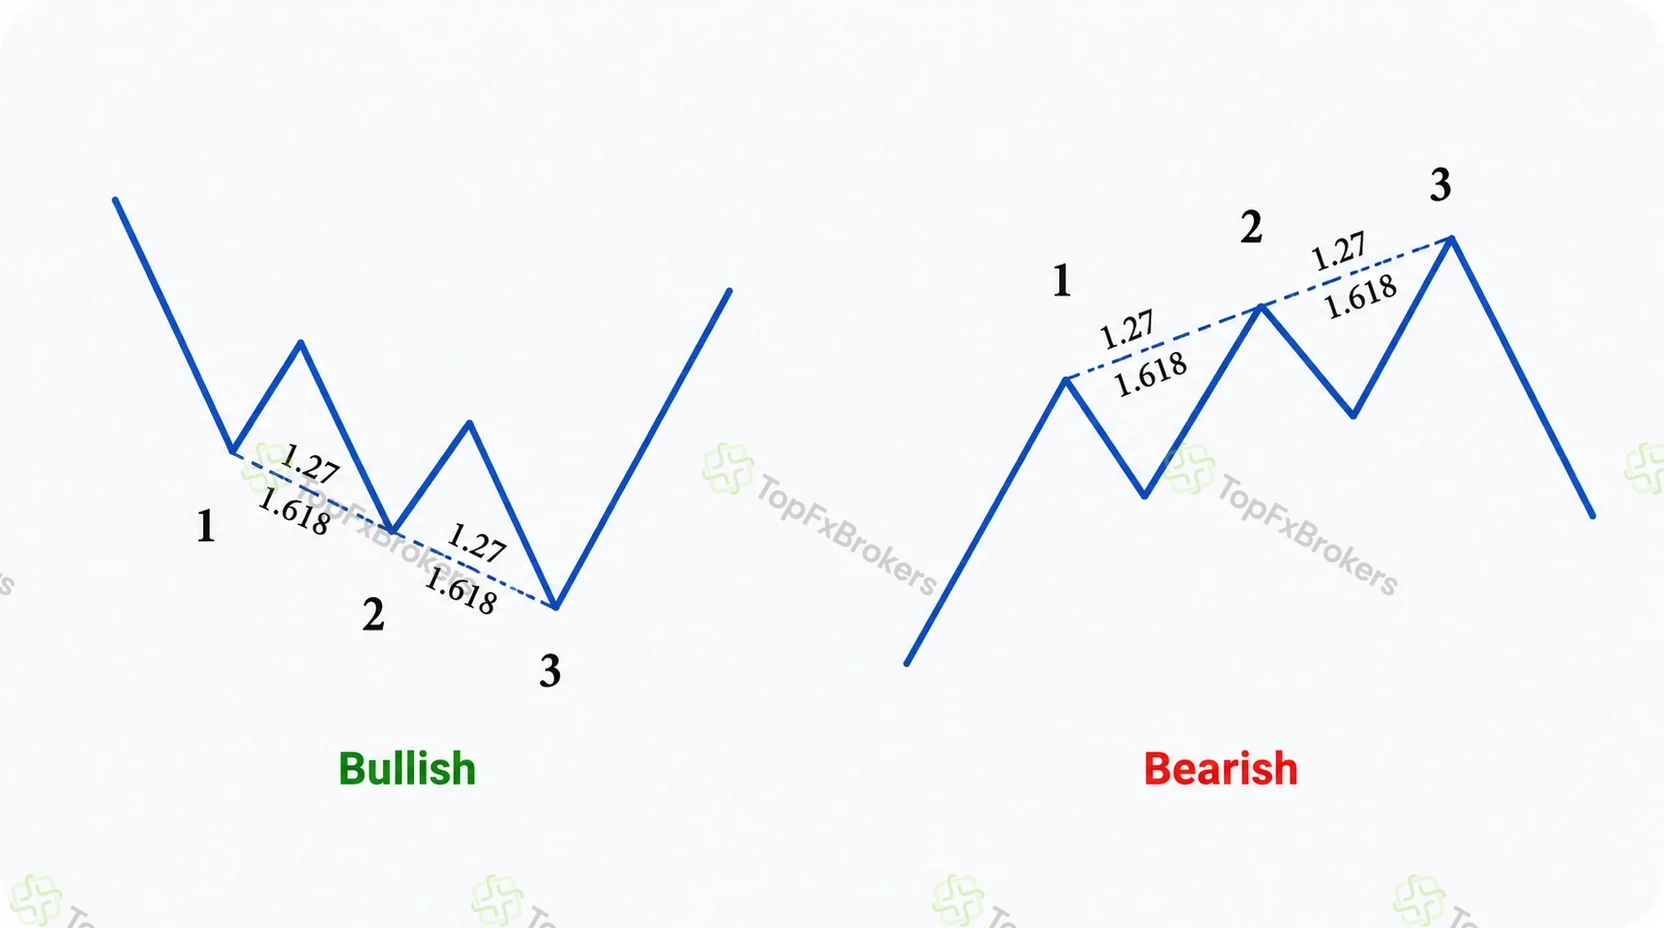
The Three-Drive pattern consists of three sequential pushes in the same direction, separated by two corrections. A bearish version forms three rising drives; a bullish version forms three falling drives. The visual rhythm is important because the formation represents repeated attempts to continue a trend with diminishing efficiency or growing exhaustion.
The corrections commonly retrace 0.618 or 0.786 of the preceding drive. Each later drive then extends the prior correction by a harmonic ratio such as 1.13, 1.272 or 1.618. The ratios do not need to be identical in every version, but the drives should show clear price and time symmetry. A third push that is dramatically faster and larger than the first two is more likely to be acceleration than a balanced exhaustion pattern.
The completion zone is built from the third drive’s extension, the symmetry of the first and second drives, and any overlapping support or resistance. A reversal can be a correction rather than a complete trend change, so targets should be based on the structure that follows instead of assuming a major top or bottom.
Harmonic Pattern Ratio Reference
The table below summarizes the ideal framework used in this guide. It is a reference for classification, not a substitute for measuring the actual chart. “C retracement” refers to BC relative to AB unless another relationship is stated.
| Pattern | B and C structure | D / PRZ measurements | Main distinction |
|---|---|---|---|
| ABCD | C = 0.382–0.886 of AB. | AB=CD; BC = 1.13–2.618. Alternate CD may be 1.272 or 1.618 of AB. | Four-point measured move; symmetry is central. |
| Gartley | B = 0.618 XA; C = 0.382–0.886 AB. | D = 0.786 XA; BC about 1.13–1.618; equivalent or 1.272 AB=CD. | Completes inside XA with a precise 0.618 B point. |
| Bat | B = 0.382–0.50 XA and below 0.618; C = 0.382–0.886 AB. | D = 0.886 XA; BC = 1.618–2.618; equivalent AB=CD minimum, 1.272 common. | Shallow B, deep internal D near X. |
| Alternate Bat | B <= 0.382 XA; C = 0.382–0.886 AB. | D = 1.13 XA; BC >= 2.0; extended AB=CD, commonly 1.618. | Very shallow B with an external D just beyond X. |
| Butterfly | B = 0.786 XA; C = 0.382–0.886 AB. | Ideal D = 1.272 XA; BC = 1.618–2.618; AB=CD to 1.272 alternate. | External completion with mandatory 0.786 B. |
| Crab | B = 0.382–0.618 XA; C = 0.382–0.886 AB. | D = 1.618 XA; BC = 2.24–3.618; alternate AB=CD commonly 1.272 or 1.618. | Extreme external D and very deep BC projection. |
| Shark | O-X-A-B-C notation; extreme impulse component is at least 1.618. | C converges near the 0.886 retracement / 1.13 reciprocal extension of OX. | Non-XABCD counter-trend reaction; active management. |
| Cypher | B = 0.382–0.618 XA; C = 1.272–1.414 extension of XA. | D = 0.786 retracement of XC. | C extends beyond A; D is measured from XC. |
| 5-0 | B projection <= 1.618 XA; BC = 1.618–2.24 AB. | D = 0.50 retracement of BC plus reciprocal AB=CD. | First pullback structure after an extended reversal. |
| Three-Drive | Corrections commonly 0.618 or 0.786 of prior drive. | Later drives often 1.13, 1.272 or 1.618 of prior correction; price/time symmetry required. | Three balanced exhaustion pushes rather than XABCD. |
How to Identify and Trade Harmonic Patterns
A repeatable process prevents the pattern name from taking over the analysis. Work from the oldest confirmed swing toward the projected completion and stop when the structure fails a rule.
1. Define the market context: trend, range boundaries, major levels, scheduled events and volatility. 2. Select meaningful pivots with the same swing rule on every chart. 3. Measure B first. The B retracement narrows the pattern family and prevents the later D point from dictating the label. 4. Validate C. Confirm that C remains within the permitted retracement or extension range and that it creates a plausible route to D. 5. Project and record the PRZ before price arrives, using the required XA or XC, BC and AB=CD measurements. 6. Observe the approach for expansion, gaps, liquidity, event risk and changing momentum. 7. Wait for the chosen trigger. Use a limit order only when that entry method has been tested; otherwise require rejection or a local structure change. 8. Set invalidation, targets and size before entry; decline an awkward or poorly rewarded setup. 9. Record the original chart and measurements. Do not redraw the pattern after the outcome.
Worked Example: Measuring a Bullish Bat
Consider a hypothetical bullish structure with X at 100 and A at 120. XA therefore measures 20 points. Price retraces to B at 110, which is a 0.50 retracement of XA and fits the preferred Bat midpoint. It then rallies to C at 115, a 0.50 retracement of the 10-point AB decline.
The Bat’s defining D level is the 0.886 retracement of XA. Measured down from A, that calculation gives 120 - (20 x 0.886) = 102.28. The 1.272 alternate AB=CD projection produces 115 - (10 x 1.272) = 102.28. BC measures 5 points; its 2.618 projection from C reaches 101.91. The three calculations create a PRZ of approximately 101.90 to 102.30 rather than one exact price.
Assume price enters the zone, rejects 102.00 and later closes above a minor confirmation swing at 103.20. A trader using confirmation could enter near 103.20 and place the invalidation below X and the observed rejection, for example at 99.60. The risk is 3.60 points. The 38.2% retracement of the AD decline lies near 109.05, while the 61.8% retracement lies near 113.23. Those targets offer approximately 1.6R and 2.8R before costs.
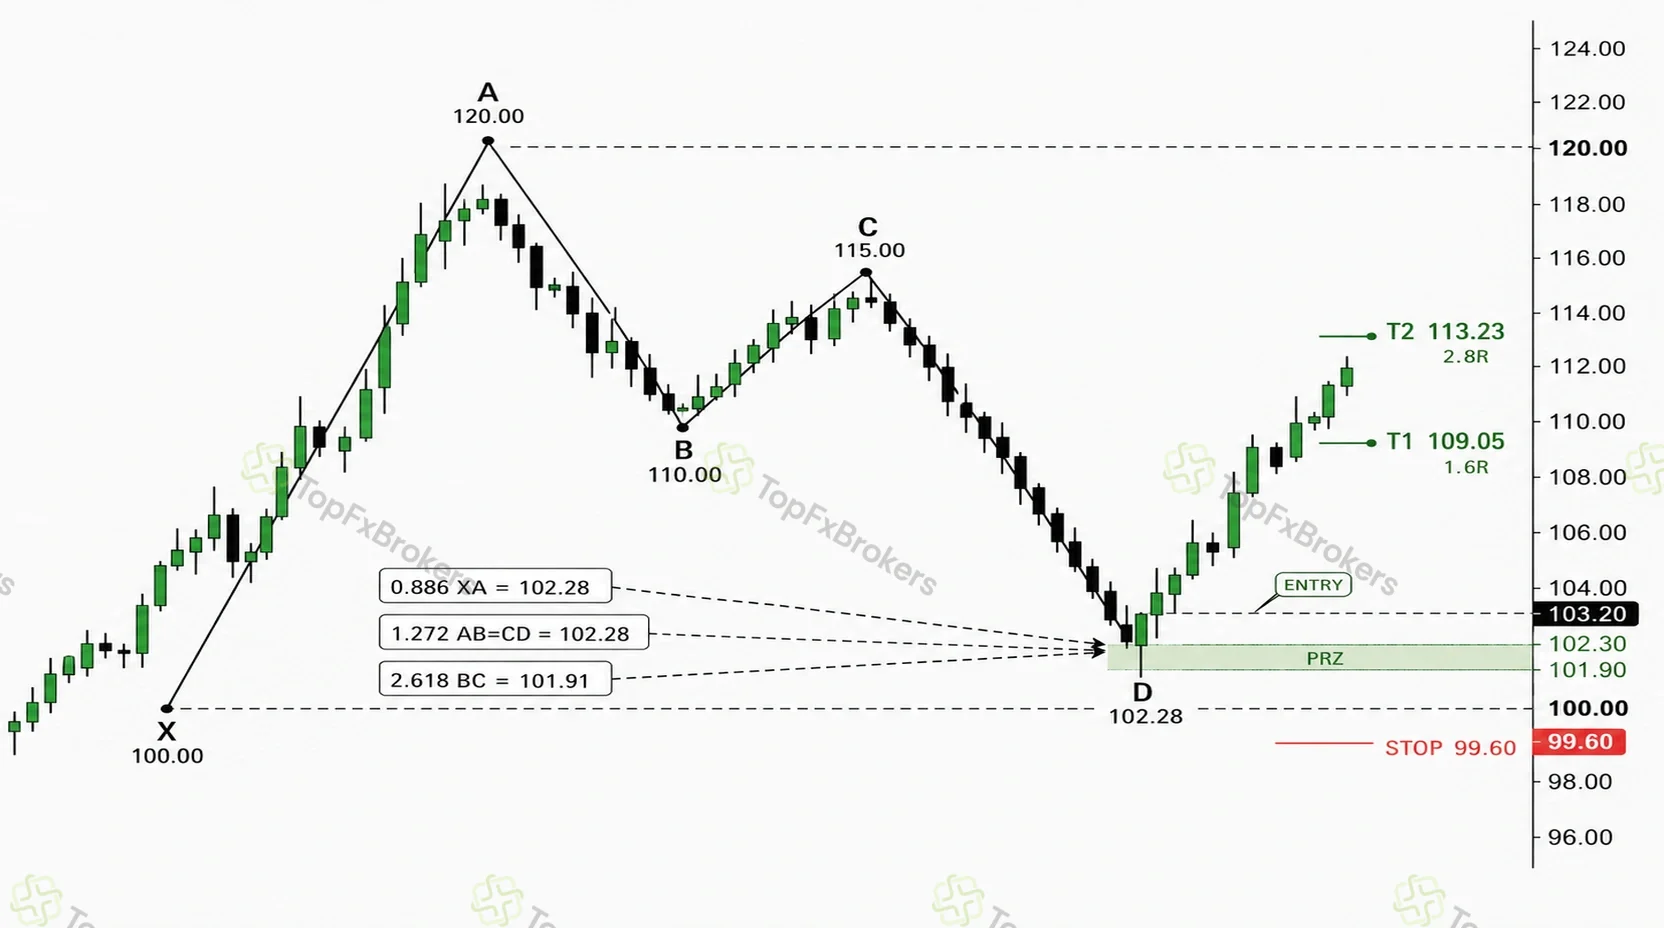
The example is useful because each measurement was available before the reversal. If price had closed decisively below X and continued through the PRZ, the Bat would have failed. It should not then be relabeled retrospectively as another pattern to make the original analysis appear correct.
When a Valid Bat Fails
Use the same pre-calculated PRZ of 101.90 to 102.30, but assume price enters with expanding bearish candles, closes at 101.50 and then holds below X at 100.00. The ratios were valid before arrival, so the structure was not misidentified; the expected reaction simply did not occur. A confirmation-based trader would remain flat because no rejection or structure shift appeared. A limit-entry trader would take the planned loss when the selected invalidation level was crossed.
The distinction matters in testing. Record this as a valid Bat with a failed reversal, including the entry method, costs and maximum adverse excursion. Do not delete the sample or reclassify it as a Deep Crab unless the Deep Crab’s 0.886 B point and 1.618 XA completion had been projected in advance. A losing outcome does not invalidate the original geometry, but it does count against the performance of the trading rules.
Entries, Stop Losses and Profit Targets
Pattern completion and trade execution are separate decisions. Two traders can agree on the same PRZ and use different entries because one prioritizes price and the other prioritizes confirmation. The method must be selected before the outcome and tested with realistic spreads, slippage and missed trades.
Entry Methods
| Method | How it works | Main advantage | Main limitation |
|---|---|---|---|
| Limit entry | Order is placed within the pre-calculated PRZ before confirmation. | Best theoretical price and smallest initial stop distance. | Highest exposure to a zone that price may cross without reacting. |
| Close-based confirmation | Entry follows a rejection candle, engulfing close or close back out of the PRZ. | Filters some momentum failures and defines a visible trigger. | Later price can reduce reward-to-risk and some reversals are missed. |
| Structure-break entry | Entry follows a break of a minor swing created after D. | Requires a measurable shift in local order flow. | Can be substantially later when the reversal is fast. |
| Stop entry | A buy stop is placed above bullish confirmation or a sell stop below bearish confirmation. | Requires continuation in the expected direction before activation. | Gaps, slippage and false breaks can worsen execution. |
Stop-Loss Placement
A stop belongs where the trade thesis is invalid or materially weakened, not at a convenient monetary distance. The same pattern may justify different stops depending on whether the entry occurred at the PRZ or after confirmation. Suitable methods include:
- Beyond the full PRZ, with a fixed volatility or spread buffer.
- Beyond X for an internal retracement pattern such as a Gartley or Bat.
- Beyond the terminal D extreme for an extension pattern when X has already been exceeded.
- Beyond the confirmation candle or the lower-timeframe swing that triggered the trade.
- At a pattern-specific make-or-break level defined in the tested methodology.
Pattern invalidation and trade invalidation are related but not identical. Pattern invalidation means the geometry no longer satisfies its definition. Trade invalidation is the observable price level that ends a specific entry thesis. A confirmation-based trade may use a closer structural stop even though the larger pattern remains geometrically intact, while a limit-entry method may allow the full pattern boundary. Both rules must be written before entry.
A tight stop is not automatically efficient. If ordinary volatility frequently crosses the level before the expected reaction, the position is under-protected rather than well controlled. Conversely, a very wide stop can preserve a low-quality idea while making the target unattractive. Reject the setup when no technically defensible stop produces acceptable risk.
Profit Targets
Targets should reflect places where price may reasonably pause, not only a desired multiple of the stop. Harmonic reversals often retrace part of the terminal AD or CD move before the broader trend becomes clear. Common reference points are:
- The 38.2% and 61.8% retracements of the AD move.
- Point B or point C, provided no nearer structure is likely to obstruct price.
- A previous support, resistance or range boundary identified before entry.
- A fixed risk multiple supported by the strategy’s historical results.
- A trailing exit behind new swing structure after partial profit has been taken.
Multiple targets can reduce the pressure to predict the full reversal. One portion may be closed at the first structural objective while the remainder is managed toward a deeper retracement. This approach is not automatically superior; transaction costs, partial fills and the frequency of extended moves must be included in testing.
Position Sizing
Position size is calculated after the entry and stop are known. Divide the amount of capital allocated to the trade by the monetary value of the stop distance, then adjust for contract size, tick value, currency conversion and estimated costs. A wider stop requires a smaller position. A smaller stop permits a larger position only when the invalidation remains technically credible.
Risk should also account for correlated exposure. Several bullish harmonic patterns across related currency pairs or equity indices may represent one underlying market view. Treating them as independent trades can multiply risk even when each position appears small on its own.
Context, Confluence and Pattern Failure
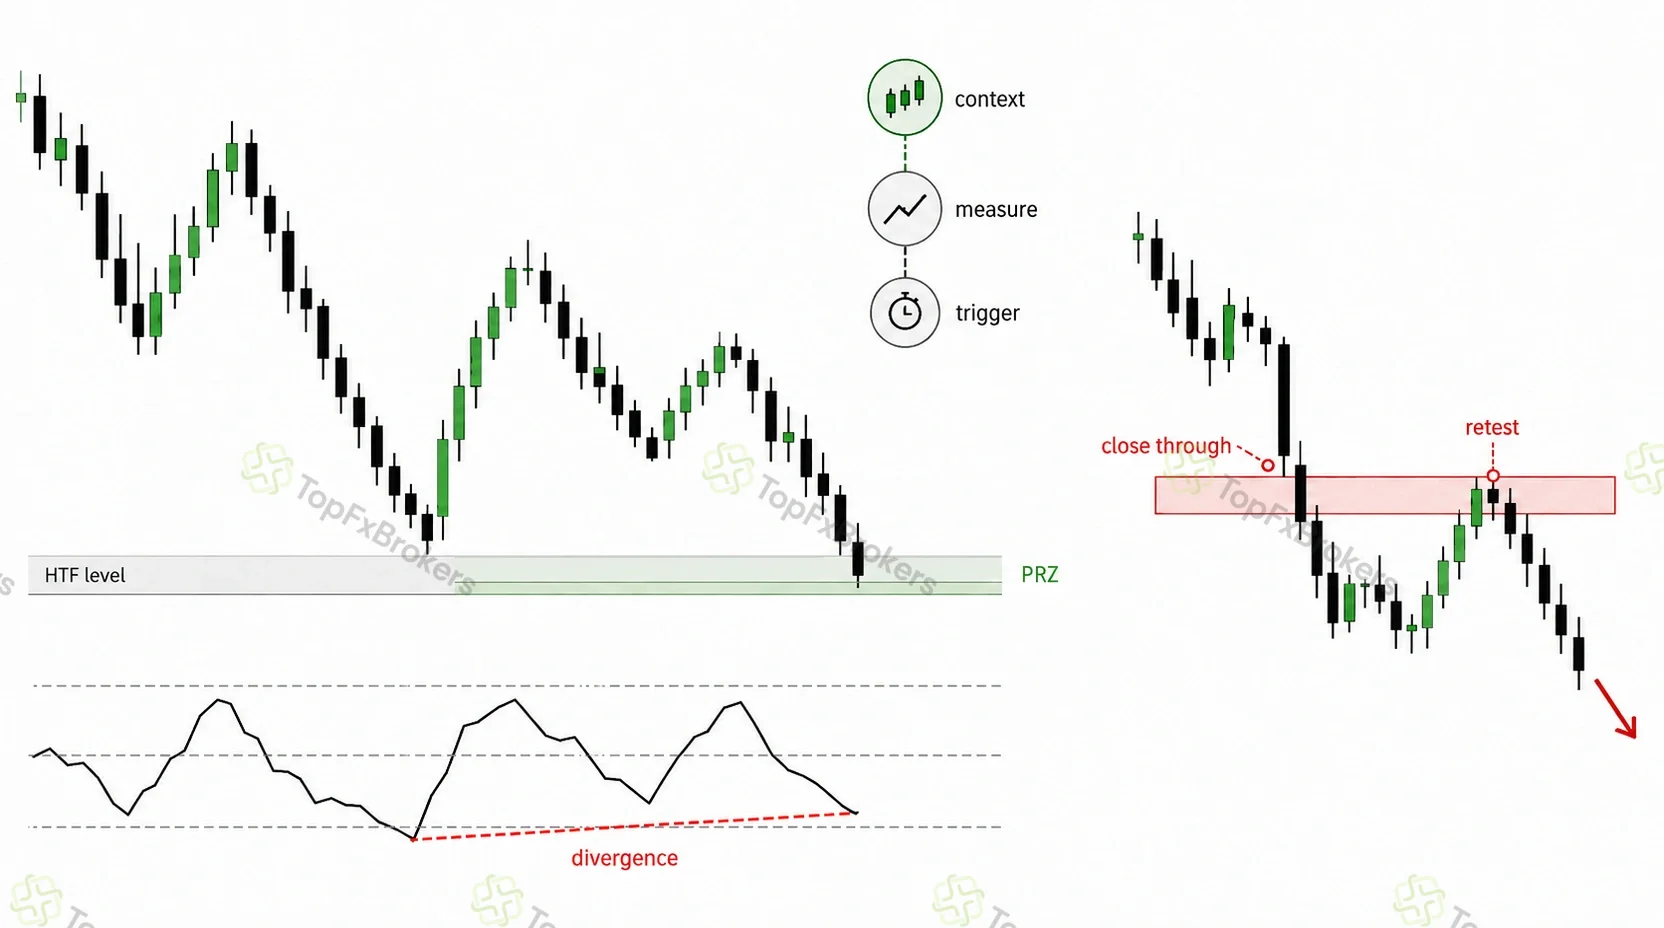
A PRZ is easier to interpret when it overlaps support, resistance or a higher-timeframe boundary marked before the pattern is measured. Momentum divergence may add context, but it cannot repair invalid ratios. A practical hierarchy uses one timeframe for context, one for measurement and, when needed, a lower timeframe for the entry trigger. Marking a level only after D has reversed turns confluence into hindsight.
A decisive failure can also provide information. When price closes through the PRZ, holds beyond it and retests the zone from the other side, the reversal thesis has been rejected. Any continuation trade is a new setup with its own entry and invalidation; a wick or small overshoot is not sufficient evidence.
Divergence can show that price has reached a new extreme without a comparable oscillator extreme. It may support a Butterfly, Crab or Three-Drive completion, but it does not correct invalid ratios or replace price confirmation. Oscillator settings should remain fixed during testing, and divergence should be defined precisely enough that two reviewers would classify the same chart similarly.
Common Mistakes to Avoid
- Entering before D is calculable or before price reaches the defined PRZ.
- Choosing the pattern name first and moving X, B or C until the ratios fit.
- Treating all values between two major ratios as acceptable without a fixed tolerance.
- Using one Fibonacci measurement as proof while ignoring the required BC or AB=CD relationship.
- Calling a failed Bat a Deep Crab, or another later pattern, without recording the original loss.
- Adding support, divergence or a trendline only after the reversal is visible.
- Ignoring spreads, gaps, financing costs, contract specifications or correlated exposure.
- Trading every scanner alert rather than using software as a candidate-generation tool.
The most useful discipline is rejection. A trader who measures carefully should discard many more structures than are traded. Selectivity is not a weakness of the method; it is the consequence of having rules.
How to Test a Harmonic Trading Strategy
Testing must separate the pattern’s geometry from the trade-management rules. A valid pattern can lose, and an invalid pattern can reverse by chance. The purpose is to determine whether a fully specified process produced an acceptable distribution of outcomes after costs.
- Choose one pattern and one market group; ABCD, Gartley or Bat reduces early classification overlap.
- Define the pivot method, ideal ratios, tolerance and treatment of intrabar penetration or closes beyond a level.
- Define the PRZ calculation. Specify which components are mandatory and how zone width is measured.
- Define context filters such as trend state, major levels, volatility and scheduled news.
- Define the entry trigger, stop method, target method and maximum time allowed for confirmation.
- Capture the chart before the outcome and store every ratio, including rejected candidates.
- Record costs and adverse execution. A small theoretical edge can disappear after spread and slippage.
- Separate results by pattern, direction, market, timeframe, volatility and entry method.
- Evaluate expectancy, win rate, average win and loss, adverse excursion, drawdown and rule compliance.
- Validate the final rules on unseen data or a later period before using them in live decision-making.
A useful test does not attempt to prove that harmonic patterns always work. It identifies where the rules were repeatable, how often the PRZ failed, which conditions produced unacceptable losses and whether the strategy was robust enough to survive small changes in assumptions.
Do Harmonic Patterns Work?
Harmonic patterns can make analysis more explicit because they define pivots, proportional relationships, a completion zone and invalidation. That does not establish a universal trading edge. A pattern may be measured correctly and still fail, while an invalid structure may reverse for unrelated reasons. Performance depends on the definition used, the pivot and tolerance rules, the entry method and the treatment of spread, slippage and financing.
Accuracy claims are meaningful only when they disclose the sample size, market and timeframe, rejected candidates, entry and exit rules, costs and out-of-sample results. The practical question is not whether harmonic patterns work everywhere, but whether one fixed implementation produces positive expectancy under the conditions in which it will be used. Until testing demonstrates that result, treat each pattern as a structured hypothesis and risk-planning tool rather than a proven forecast.
Harmonic Trading Checklist
Before entering a harmonic setup, ask:
- Are the swing points clear under the written pivot rule?
- Was the pattern family identified from B and C before D completed?
- Do all defining ratios fall within the fixed tolerance?
- Does the AB=CD or alternate AB=CD relationship support the structure?
- Do the required XA, XC and BC calculations form a compact PRZ?
- Was the surrounding support, resistance and trend context marked in advance?
- Has price produced the exact confirmation required by the strategy?
- Is the invalidation level technical, observable and far enough from ordinary noise?
- Are the targets based on realistic structure and sufficient reward?
- Has position size been calculated from the actual stop distance and contract value?
- Are spread, slippage, financing, volatility and event risk acceptable?
- Has correlated exposure across other positions been considered?
- Has the original chart and pre-trade reasoning been saved?
- Would the trade still qualify if the pattern name were hidden?
When several answers are uncertain, the chart is not offering a precise setup. Passing on it preserves both capital and the integrity of the test data.
Conclusion
Harmonic trading is most useful as a framework for disciplined measurement. It narrows attention to a zone where a defined structure may be completing, then requires the trader to judge the reaction and control the risk.
A credible setup begins with stable pivots, meets a stated ratio definition and creates a compact PRZ before price arrives. It becomes tradable only when the entry method, invalidation and realistic targets fit a tested plan. Patterns will still fail. Recording those failures without relabeling them is what turns harmonic analysis from attractive chart drawing into a process that can be evaluated.
FAQ
Are harmonic patterns reliable?
They can organize a chart and define risk, but the geometry does not guarantee a reversal. Reliability depends on the exact pattern rules, market, timeframe, costs, confirmation and testing method. Claims about a universal win rate should be treated cautiously unless the full dataset and rules are available.
Which harmonic pattern is best for beginners?
The ABCD is usually the clearest introduction because it teaches retracement, projection and symmetry with only four points. Gartley and Bat are logical next steps because their B and D measurements are distinct and both complete inside XA.
What is the difference between a Gartley and a Bat?
The Gartley uses B near 0.618 XA and D near 0.786 XA. The Bat uses a shallower B, preferably 0.382 to 0.50, and a deeper D at 0.886 XA. The Bat also requires a more extended BC projection.
What is the difference between a Butterfly and a Crab?
Both complete beyond X. The ideal Butterfly has B at 0.786 XA and D at 1.272 XA. The Crab usually has B between 0.382 and 0.618 XA and D at 1.618 XA, supported by a much more extreme BC projection.
Should a trade be entered as soon as D is reached?
Only when a pre-tested limit-entry strategy permits it. Otherwise, D is the area to observe. Waiting for rejection or a structure change reduces exposure to patterns that complete numerically but continue through the PRZ.
Where should the stop loss be placed?
The stop should sit beyond the point that invalidates the tested setup: outside the PRZ, beyond X, beyond D or beyond the confirmation structure. The correct choice depends on the pattern and entry method. A random fixed distance is not a technical invalidation.
How wide should the ratio tolerance be?
There is no universal setting. Use the narrowest range that produces enough objectively measurable samples, keep it constant and verify the result on unseen data. Wider tolerance increases the number of candidates but also increases overlap and subjectivity.

Written by:
Daniel Harris
At TopFxBrokers, Daniel focuses on broker reviews, platform comparisons, educational guides, and market analysis. His writing emphasizes transparency, accuracy, and balanced evaluations, enabling readers to make informed trading decisions. He regularly follows central bank policies, economic data releases, and industry developments to keep his research current and relevant.
Daniel's goal is to make financial markets more accessible to both new and experienced traders by presenting objective information in a straightforward, easy-to-understand format.